(Pictured: A man who is not clear on the concept)
Population
56.6 million The Hispanic population of the United States as of July 1, 2015, making people of Hispanic origin the nation’s largest ethnic or racial minority. Hispanics constituted 17.6 percent of the nation’s total population.
Source: Vintage 2015 Population Estimates
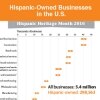
Hispanic-Owned Businesses in the U.S.
July 28, 2016
(Sectors With at Least 50,000 Businesses)
1.2 million The number of Hispanics added to the nation’s population between July 1, 2014, and July 1, 2015. This number is nearly half of the approximately 2.5 million people added to the nation’s total population during this period.
Source: Vintage 2015 Population Estimates
2.2% The percentage increase in the Hispanic population between 2014 and 2015.
Source: Vintage 2015 Population Estimates
119 million The projected Hispanic population of the United States in 2060. According to this projection, the Hispanic population will constitute 28.6 percent of the nation’s population by that date.
Source: 2014 National Population Projections, Table 10
63.4% The percentage of those of Hispanic or Latino origin in the United States who were of Mexican origin in 2015. Another 9.5 percent were Puerto Rican, 3.8 percent Salvadoran, 3.7 percent Cuban, 3.3 percent Dominican and 2.4 percent Guatemalan. The remainder were of some other Central American, South American or other Hispanic or Latino origin.
Source: 2014 American Community Survey, Table B03001
States and Counties
10.7 million The estimated population for those of Hispanic origin in Texas as of July 1, 2015.
Source: Vintage 2015 Population Estimates
9 The number of states with a population of 1 million or more Hispanic residents in 2015 — Arizona, California, Colorado, Florida, Illinois, New Jersey, New Mexico, New York and Texas.
Source: Vintage 2015 Population Estimates
54.5% The percentage of the Hispanic population in the United States that lived in California, Florida and Texas as of July 1, 2015.
Source: Vintage 2015 Population Estimates
15.2 million The Hispanic population of California. This is the largest Hispanic population of any state.
Source: Vintage 2015 Population Estimates
4.9 million Los Angeles County had the largest Hispanic population of any county in 2015.
Source: Vintage 2015 Population Estimates
49,000 Harris County in Texas had the largest numeric increase of Hispanics from 2014 to 2015.
Source: Vintage 2015 Population Estimates
Families and Children
16.2 million The number of Hispanic households in the United States in 2015.
Source: Families and Living Arrangements, Households, Table H-3
47.7% The percentage of Hispanic households that were married-couple households in 2015. Among all households in the United States, 48.2 percent were married-couple households.
Source: Families and Living Arrangements, Table H-3
57.6% The percentage of Hispanic married-couple households that had children younger than age 18 present in 2015, whereas for all married-couple households it was 64.3 percent.
Source: Families and Living Arrangements, Table H-3
66.8% The percentage of Hispanic parent/child family groups that included two parents in 2015, whereas for all parent/child family groups, it was 69.5 percent.
Source: Families and Living Arrangements, Table FM-2
46.0% The percentage of Hispanic married couples with children under age 18 where both spouses were employed in 2014, whereas nationwide it was 59.7 percent.
Source: Families and Living Arrangements, Table FG-1
Spanish Language
40 million The number of U.S. residents age 5 and older who spoke Spanish at home in 2015. This is a 131.2 percent increase since 1990 when it was 17.3 million. Those who hablan español en casa constituted 13.3 percent of U.S. residents age 5 and older. More than half (59 percent of all Spanish speakers and 57.4 percent of Hispanic Spanish speakers) spoke English “very well.”
Sources:
 1990 Decennial Census
2015 American Community Survey, Table DP02
Language Spoken at Home by Ability to Speak English for the Population 5 Years and Over (Hispanic or Latino)
2015 American Community Survey, Table B16006
2015 American Community Survey, Table S1601
2015 American Community Survey, Table S1601
72.9% The percentage of Hispanics age 5 and older who spoke Spanish at home in 2015.
Source:
2015 American Community Survey, Table B16006
Income, Poverty and Health Insurance
$45,150 The median income of Hispanic households in 2015.
Source: Income and Poverty in the United States: 2015, Table 1
21.4% The poverty rate among Hispanics in 2015.
Source: Income and Poverty in the United States: 2015, Table 3
16.2% The percentage of Hispanics who lacked health insurance in 2015.
Source: Health Insurance Coverage in the United States: 2015, Table 5
Education
66.0% The percentage of Hispanics age 25 and older that had at least a high school education in 2015.
Source: 2015 American Community Survey, Table B15002I
14.8% The percentage of the Hispanic population age 25 and older with a bachelor’s degree or higher in 2015.
Source: 2015 American Community Survey, Table B15002I
4.7 million The number of Hispanics age 25 and older who had at least a bachelor’s degree in 2015.
Source: 2015 American Community Survey, Table B15002I
1.5 million The number of Hispanics age 25 and older with advanced degrees in 2015 (e.g., master’s, professional, doctorate).
Source: 2015 American Community Survey, Table B15002I
17.0% The percentage of students (both undergraduate and graduate) enrolled in college in 2015 who were Hispanic.
Source:
2015 American Community Survey, Tables B14007
2015 American Community Survey, Tables B14007I
24.3% The percentage of elementary and high school students that were Hispanic in 2015.
Source:
2015 American Community Survey, Tables B14007
2015 American Community Survey, Tables B14007I
Foreign-Born
34.5% The percentage of the Hispanic population that was foreign-born in 2015.
Source: 2015 American Community Survey, Table B05003I
64.3% The percentage of the 10.3 million noncitizens under the age of 35 who were born in Latin America and the Caribbean and are living in the United States in 2010-2012.
Source: Noncitizens Under Age 35: 2010-2012, American Community Survey Brief
Jobs 67.0%
The percentage of Hispanics or Latinos age 16 and older who were in the civilian labor force in 2015.
Source: 2015 American Community Survey, Table S2301
20.5% The percentage of civilian employed Hispanics or Latinos age 16 and older who worked in management, business, science and arts occupations in 2015.
Source: 2015 American Community Survey, Table B24010I
Voting
8.4% The percentage of voters in the 2012 presidential election who were Hispanic. Hispanics comprised 4.7 percent of voters in 1996.
Source: The Diversifying Electorate—Voting Rates by Race and Hispanic Origin in 2012 (and Other Recent Elections), Population Characteristics, Table 3
7.3% The percentage of voters in the 2014 congressional election who were Hispanic.
Source: Who Votes? Congressional Elections and the American Electorate: 1978-2014, Population Characteristics, Figure 5
Serving our Country
1.2 million The number of Hispanics or Latinos age 18 and older who are veterans of the U.S. armed forces.
Source: 2015 American Community Survey, Table B21001I
Business
3.3 million Estimated number of Hispanic-owned firms nationally in 2012, up from 2.3 million or 46.3 percent from 2007.
Source: 2012 Survey of Business Owners-Hispanic Owned Firms: 2012
91.3% The estimated percentage of the 3.3 million Hispanic-owned firms that had no paid employees. Of all U.S. businesses, 80.4 percent were nonemployer firms.
Source: 2012 Survey of Business Owners- Hispanic Owned Firms: 2012
$78.7 million The estimated sales/receipts reported by Hispanic firms owned by women in 2012. Male-owned Hispanic firms reported sales of $359.1 million.
Source: 2012 Survey of Business Owners-Hispanic Owned Firms: 2012
Population
56.6 million The Hispanic population of the United States as of July 1, 2015, making people of Hispanic origin the nation’s largest ethnic or racial minority. Hispanics constituted 17.6 percent of the nation’s total population.
Source:
Vintage 2015 Population EstimatesHispanic-Owned Businesses in the U.S.
July 28, 2016
(Sectors With at Least 50,000 Businesses)
1.2 million The number of Hispanics added to the nation’s population between July 1, 2014, and July 1, 2015. This number is nearly half of the approximately 2.5 million people added to the nation’s total population during this period.
Source:
Vintage 2015 Population Estimates2.2% The percentage increase in the Hispanic population between 2014 and 2015.
Source:
Vintage 2015 Population Estimates119 million The projected Hispanic population of the United States in 2060. According to this projection, the Hispanic population will constitute 28.6 percent of the nation’s population by that date.
Source:
2014 National Population Projections, Table 1063.4% The percentage of those of Hispanic or Latino origin in the United States who were of Mexican origin in 2015. Another 9.5 percent were Puerto Rican, 3.8 percent Salvadoran, 3.7 percent Cuban, 3.3 percent Dominican and 2.4 percent Guatemalan. The remainder were of some other Central American, South American or other Hispanic or Latino origin.
Source:
2014 American Community Survey, Table B03001States and Counties
10.7 million The estimated population for those of Hispanic origin in Texas as of July 1, 2015.
Source:
Vintage 2015 Population Estimates9 The number of states with a population of 1 million or more Hispanic residents in 2015 — Arizona, California, Colorado, Florida, Illinois, New Jersey, New Mexico, New York and Texas.
Source:
Vintage 2015 Population Estimates54.5% The percentage of the Hispanic population in the United States that lived in California, Florida and Texas as of July 1, 2015.
Source:
Vintage 2015 Population Estimates15.2 million The Hispanic population of California. This is the largest Hispanic population of any state.
Source:
Vintage 2015 Population Estimates4.9 million Los Angeles County had the largest Hispanic population of any county in 2015.
Source:
Vintage 2015 Population Estimates49,000 Harris County in Texas had the largest numeric increase of Hispanics from 2014 to 2015.
Source:
Vintage 2015 Population EstimatesFamilies and Children
16.2 million The number of Hispanic households in the United States in 2015.
Source:
Families and Living Arrangements, Households, Table H-347.7% The percentage of Hispanic households that were married-couple households in 2015. Among all households in the United States, 48.2 percent were married-couple households.
Source:
Families and Living Arrangements, Table H-357.6% The percentage of Hispanic married-couple households that had children younger than age 18 present in 2015, whereas for all married-couple households it was 64.3 percent.
Source:
Families and Living Arrangements, Table H-366.8% The percentage of Hispanic parent/child family groups that included two parents in 2015, whereas for all parent/child family groups, it was 69.5 percent.
Source:
Families and Living Arrangements, Table FM-246.0% The percentage of Hispanic married couples with children under age 18 where both spouses were employed in 2014, whereas nationwide it was 59.7 percent.
Source:
Families and Living Arrangements, Table FG-1Spanish Language
40 million The number of U.S. residents age 5 and older who spoke Spanish at home in 2015. This is a 131.2 percent increase since 1990 when it was 17.3 million. Those who hablan español en casa constituted 13.3 percent of U.S. residents age 5 and older. More than half (59 percent of all Spanish speakers and 57.4 percent of Hispanic Spanish speakers) spoke English “very well.”
Sources:
1990 Decennial Census 2015 American Community Survey, Table DP02Language Spoken at Home by Ability to Speak English for the Population 5 Years and Over (Hispanic or Latino)
2015 American Community Survey, Table B160062015 American Community Survey, Table S1601
2015 American Community Survey, Table S160172.9% The percentage of Hispanics age 5 and older who spoke Spanish at home in 2015.
Source:
2015 American Community Survey, Table B16006Income, Poverty and Health Insurance
$45,150 The median income of Hispanic households in 2015.
Source:
Income and Poverty in the United States: 2015, Table 121.4% The poverty rate among Hispanics in 2015.
Source:
Income and Poverty in the United States: 2015, Table 316.2% The percentage of Hispanics who lacked health insurance in 2015.
Source:
Health Insurance Coverage in the United States: 2015, Table 5Education
66.0% The percentage of Hispanics age 25 and older that had at least a high school education in 2015.
Source:
2015 American Community Survey, Table B15002I14.8% The percentage of the Hispanic population age 25 and older with a bachelor’s degree or higher in 2015.
Source:
2015 American Community Survey, Table B15002I4.7 million The number of Hispanics age 25 and older who had at least a bachelor’s degree in 2015.
Source:
2015 American Community Survey, Table B15002I1.5 million The number of Hispanics age 25 and older with advanced degrees in 2015 (e.g., master’s, professional, doctorate).
Source:
2015 American Community Survey, Table B15002I17.0% The percentage of students (both undergraduate and graduate) enrolled in college in 2015 who were Hispanic.
Source:
2015 American Community Survey, Tables B14007 2015 American Community Survey, Tables B14007I24.3% The percentage of elementary and high school students that were Hispanic in 2015.
Source:
2015 American Community Survey, Tables B14007 2015 American Community Survey, Tables B14007IForeign-Born
34.5% The percentage of the Hispanic population that was foreign-born in 2015.
Source:
2015 American Community Survey, Table B05003I64.3% The percentage of the 10.3 million noncitizens under the age of 35 who were born in Latin America and the Caribbean and are living in the United States in 2010-2012.
Source:
Noncitizens Under Age 35: 2010-2012, American Community Survey BriefJobs 67.0%
The percentage of Hispanics or Latinos age 16 and older who were in the civilian labor force in 2015.
Source:
2015 American Community Survey, Table S230120.5% The percentage of civilian employed Hispanics or Latinos age 16 and older who worked in management, business, science and arts occupations in 2015.
Source:
2015 American Community Survey, Table B24010IVoting
8.4% The percentage of voters in the 2012 presidential election who were Hispanic. Hispanics comprised 4.7 percent of voters in 1996.
Source:
The Diversifying Electorate—Voting Rates by Race and Hispanic Origin in 2012 (and Other Recent Elections), Population Characteristics, Table 37.3% The percentage of voters in the 2014 congressional election who were Hispanic.
Source:
Who Votes? Congressional Elections and the American Electorate: 1978-2014, Population Characteristics, Figure 5Serving our Country
1.2 million The number of Hispanics or Latinos age 18 and older who are veterans of the U.S. armed forces.
Source:
2015 American Community Survey, Table B21001IBusiness
3.3 million Estimated number of Hispanic-owned firms nationally in 2012, up from 2.3 million or 46.3 percent from 2007.
Source:
2012 Survey of Business Owners-Hispanic Owned Firms: 201291.3% The estimated percentage of the 3.3 million Hispanic-owned firms that had no paid employees. Of all U.S. businesses, 80.4 percent were nonemployer firms.
Source:
2012 Survey of Business Owners- Hispanic Owned Firms: 2012$78.7 million The estimated sales/receipts reported by Hispanic firms owned by women in 2012. Male-owned Hispanic firms reported sales of $359.1 million.
Source:
2012 Survey of Business Owners-Hispanic Owned Firms: 2012