Attitudes Toward Religious Groups
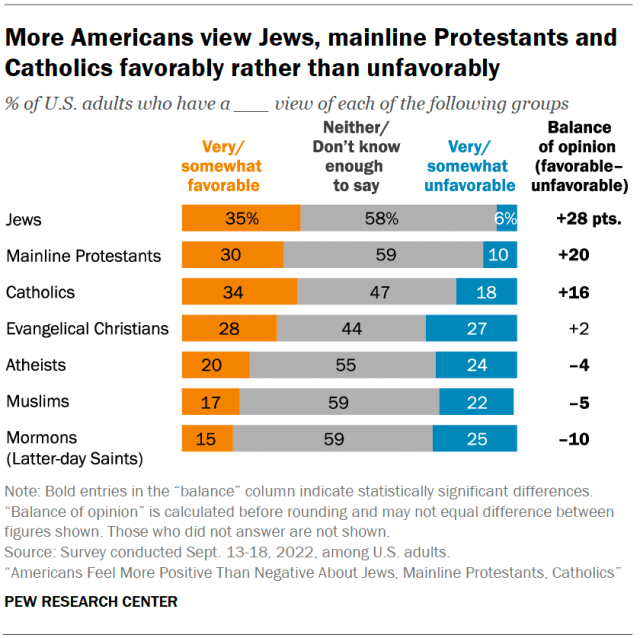
Patricia Tevington at Pew:Far more Americans express favorable than unfavorable views of Jews, mainline Protestants and Catholics, according to a recent Pew Research Center survey that measures U.S. adults’ broad sentiments toward several religious groups.
At the other end of the spectrum, more Americans express negative than positive attitudes toward atheists, Muslims and Mormons (members of the Church of Jesus Christ of Latter-day Saints).
Some survey respondents may find it strange or difficult to be asked to rate an entire group of people. Indeed, most Americans give a neutral response – or choose not to answer the question – when asked about some religious groups. For example, about six-in-ten U.S. adults (59%) say they hold “neither favorable nor unfavorable” views of Muslims or “don’t know enough to say,” while 17% express very or somewhat favorable views of Muslims and 22% express very or somewhat unfavorable views of the group.
The patterns are affected in part by the size of the groups asked about, since people tend to rate their own religious group positively. This means that the largest groups – such as Catholics and evangelical Christians – get a lot of favorable ratings just from their own members. One way to adjust for this is to examine how people rate all religious groups except their own.
Looking at the data this way, it is clear that non-Catholic Americans have a net positive view of Catholics. But there is a big difference between the way that evangelical Christians are rated by the whole public (including roughly one-quarter of U.S. adults who describe themselves as born-again or evangelical Protestants) and the way they are rated by people who are not evangelicals.
Overall, similar shares of the whole public say they view evangelical Christians favorably (28%) and unfavorably (27%). But among Americans who are not themselves born-again or evangelical Protestants, the balance of opinion is much more negative (32% unfavorable vs. 18% favorable). Some of this sentiment is tied up with politics: Democrats who are not born-again or evangelical Protestants are far more likely than non-evangelical Republicans to view evangelicals negatively (47% vs. 14%, respectively).