A previous post looked at the relationship of geography and inequality.
At New Geography, Richard Morrill writes (h/t Fred Lynch):
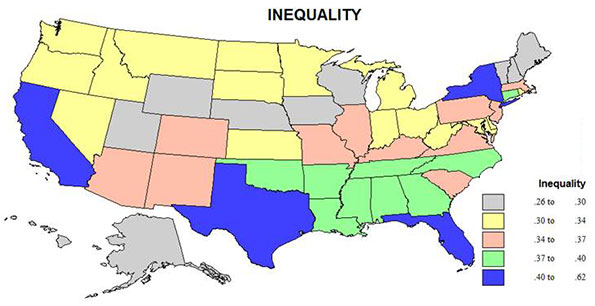
Inequality is a measure of how far the distribution of incomes differs from if all households had the same income. The gini coefficient is the most popular measure of income inequality. But for my maps I instead use a simple measure of the difference between the median and mean, divided by the median, or the percent by which the mean is higher (or lower) than the median. Values above .39 (the figure for the US as a whole) are considered quite high. It should be noted that areas of highest or lowest incomes are not necessarily very unequal, if mostly all are rich or all are poor. Rather it is the juxtaposition of poor and rich households in the same state or area that best demonstrates the true geography of inequality.
...
Only four states, New York, California, Texas, and Florida, plus Washington, DC have inequality above the national average of .39, indicating both their very large populations, their very complex ethnicity, and large metropolitan economies rich in high income earners, entrenched concentrations of poverty, and high levels of immigration. Surprisingly, these states are even more unequal than the poorest states with the most difficult racial history and delayed development: Mississippi, Alabama, Arkansas, and Louisiana.