Historical Apportionment Map
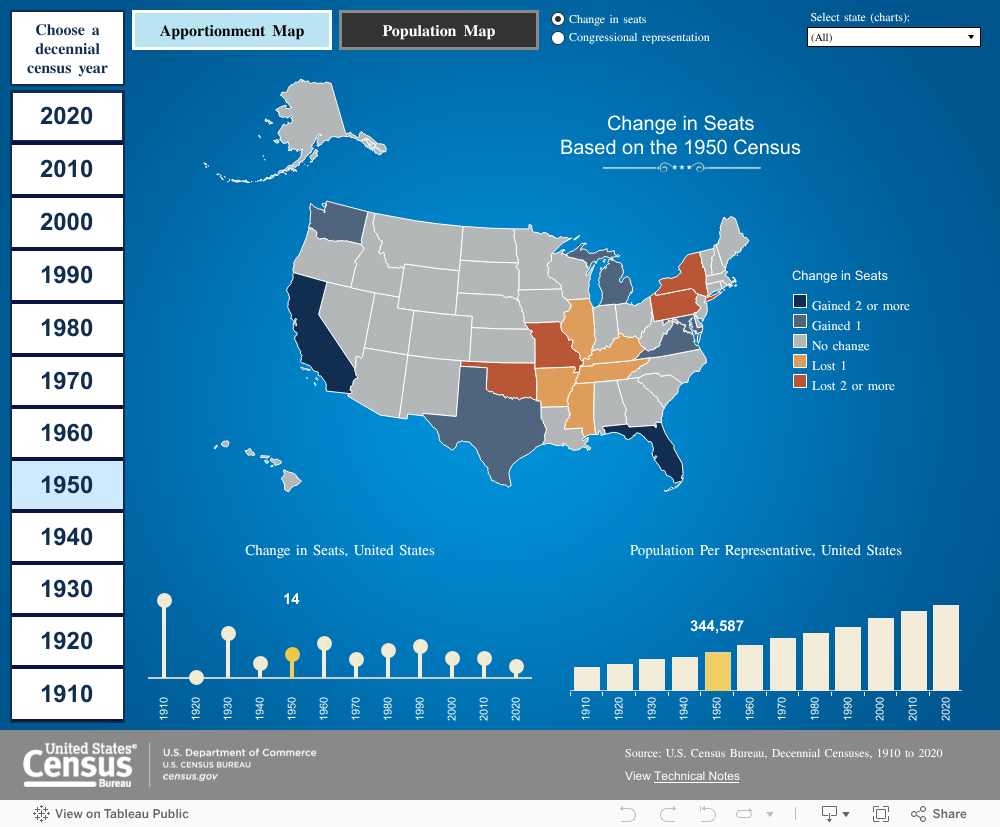
The U.S. Census Bureau reported last week on a new online map today ahead of the 2020 Census apportionment results release. The “Historical Apportionment Data Map” currently displays apportionment results for each census from 1910 to 2010. 2020 Census apportionment results will be added to the map as they become available.
Apportionment is the process of dividing the 435 memberships, or seats, in the U.S. House of Representatives among the 50 states based on the apportionment population counts from the decennial census. Article I, Section 2 of the U.S. Constitution requires that a census of the population be taken every 10 years to apportion seats in Congress.
The interactive map includes the following types of data for each census from 1910 to 2010:
- Number of seats in the U.S. House of Representatives.
- Changes to each state’s number of seats in the U.S. House of Representatives.
- Population per representative for each state.
- Resident population of each state.
- Percentage change in resident population for each state.
- Population density of each state.
The interactive map also features:
- Downloadable tables showing the source data.
- Technical documentation.
- Optimization for mobile use.
The apportionment population count includes the resident population of the 50 states, plus the overseas federal employees (military and civilian) and their dependents living with them who could be allocated to their home states. The population of the District of Columbia is not included in the apportionment population because it does not have any voting seats in the U.S. House of Representatives.