Search This Blog

Showing posts with label reapportionment. Show all posts

Thursday, July 21, 2022

Citizenship and the Census

 Sam Levine at The Guardian:

Donald Trump’s administration tried to add a citizenship question to the decennial census as part of an effort to alter the way the US House’s 435 seats are divvied up among the 50 states, a new tranche of documents reveals.

The documents, released by the House oversight committee on Wednesday, offer the clearest evidence to date that the Trump administration’s public justification for adding the question was made up. For years, the administration said that it needed to add a citizenship question to the decennial survey because better citizenship data was needed to enforce the Voting Rights Act (VRA). The US supreme court ultimately blocked the Trump administration from adding the question in 2019, saying the rationale “seems to have been contrived”.

...

Excluding non-citizens from the apportionment count, and therefore diminishing their political representation, has long been a goal of hard-right immigration groups. It would have clear political impact: California, Texas, and Florida all would have lost out on a congressional seat if unauthorized immigrants were excluded from apportionment, a 2020 projection by Pew found. Alabama, Minnesota, and Ohio all would have been able to hold on to an additional seat.

Commerce secretary Wilbur Ross became interested in adding a citizenship question shortly after taking office in 2017.

That year, James Uthmeier, a commerce department attorney, set out to analyze the legality of adding a citizenship question to the census at the request of Earl Comstock, a political appointee serving in a top policy role at the agency. In an undated memo released Wednesday, he concluded that doing so would not be lawful. The document makes it clear there is little evidence those who drafted the constitution wanted to exclude non-citizens from apportionment.

“Their conscious choice not to except aliens from the directive to count the population suggests the Founders did not intend to distinguish between citizens and non-citizens for the ‘actual Enumeration’ used for apportionment,” Uthmeier wrote in the draft memo.

“Over two hundred years of precedent, along with substantially convincing historical and textual arguments suggest that citizenship data likely cannot be used for purposes of apportioning representatives,” he added. “Without opining on the wisdom of such an action, a citizenship status question may legally be included on the decennial census so long as the collected information is not used for apportionment.”

But in subsequent drafts throughout 2017, Uthmeier and Comstock substantially changed that analysis.

They revised the memo to suggest there was much more ambiguity into whether a citizenship question could be added for apportionment purposes. By August 2017, they turned in a memo to Ross suggesting there was a legal basis for adding the question for apportionment purposes. “There are bases for legal arguments that the Founding Fathers intended for the apportionment count to be based on legal inhabitants,” the new memo said. “If the Secretary decides that the question is needed for apportionment purposes, then it must be included on the decennial.”

Friday, May 20, 2022

Undercount and Overcount

Many posts have discussed the census and population trends.

From the Census Bureau:

The U.S. Census Bureau today released the 2020 Census estimated undercount and overcount rates by state and the District of Columbia from the Post-Enumeration Survey (PES). Also released today are estimated coverage rates by census operation. This includes coverage rates by mode of self-response, and by respondent type in the Nonresponse Followup operation.


“The release of these PES estimates assists us in understanding how well we did this decade, state by state, in our efforts to count everyone living in the United States,” Census Bureau Director Robert L. Santos said. “Transparency is a critical aspect of scientific integrity. That is why we are releasing these results to the public. Our assessments – including the 2020 Census quality indicators, the PES, and the Demographic Analysis released earlier this year – offer valuable insights into the quality of the 2020 Census counts. Although none of the assessments alone can be considered definitive since no “true count” of the population exists, today’s PES results suggest that some states experienced undercounts or overcounts.”

The PES estimates show how well the 2020 Census counted everyone in the nation by creating an independent estimate of the number of people living in the United States on April 1, 2020 (excluding people in group quarters, such as nursing homes or college dorms, and people in Remote Alaska areas), surveying a sample of people in households in the United States and matching those responses to their records in the 2020 Census.

“Achieving an accurate count for all 50 states and DC is always a difficult endeavor, and these results suggest it was difficult again in 2020, particularly given the unprecedented challenges we faced,” Santos added. “It is important to remember that the quality of the 2020 Census total population count is robust and consistent with that of recent censuses. However, we know there is still more work to do in planning future censuses to ensure equitable coverage across the United States and we are working to overcome any and all obstacles to achieve that goal.”

This release includes:Undercount and overcount estimates for states, the District of Columbia (a state equivalent) and regions.
Components of coverage by state and the District of Columbia to estimate the proportions of census records that are correct, wrong, or we don’t have enough information to be sure one way or the other. They include correct enumerations, erroneous enumerations, whole-person imputations, and omissions.
National components of census coverage: Correct or erroneous enumerations and whole-person imputations by census operation and mode, including self-response by mode (internet, telephone, paper) and Nonresponse Followup by type of enumeration.

Key findings: 
  • 37 states (or state equivalent) did not have estimated statistically significant undercounts or overcounts.
  • 14 states (or state equivalent) are estimated to have had an undercount or overcount – a net coverage error statistically different from zero – meaning they were either undercounted or overcounted.Undercount: Arkansas (-5.04%), Florida (-3.48%), Illinois (-1.97%), Mississippi (-4.11%), Tennessee (-4.78%) and Texas (-1.92%).
  • Overcount: Delaware (+5.45%), Hawaii (+6.79%), Massachusetts (+2.24%), Minnesota (+3.84%), New York (+3.44%), Ohio (+1.49%), Rhode Island (+5.05%) and Utah (+2.59%).
Visit the data visualization for a look at coverage for all states and the District of Columbia.

Saturday, December 11, 2021

Enlarging the House

 Lee Drutman and Yuval Levin at WP:

Today’s vast districts put more distance between members and constituents in ways that tend to impose shallow, polarized, national frameworks on our society’s complex political topography. Members therefore tend to abstract away from their constituents — and those constituents know it.

In 2008, political scientist Brian Frederick found that — even given the relative uniformity of House districts — the smaller the district size, the more likely citizens were to have contact with their representatives and reach out to them for help, to think their representatives did a good job keeping in touch with the district, and to approve of their representative.

As former tea party Republican congressman Keith Rothfus put it recently, as “the number of people represented by a single member increases, each American’s voice in government grows smaller. Expanding the House would amplify those voices in our national government, thereby returning a greater measure of sovereignty to the people.”

More House members representing a finer-grained political diversity could also make meaningful intraparty factions more likely, and with them a greater possibility of legislative bargaining and accommodation across party lines.

Of course, any expansion would need to recognize that the House is intended to enable face-to-face bargaining, so it can only grow so large. How large? A group of scholars — including the two of us — convened by the American Academy of Arts and Sciences recently considered several options. In a new report, we recommend adding 150 seats, taking the House to 585 members. The chamber would then continue to grow with every decade’s census, following a formula roughly intended to ensure that no state loses seats, as was done throughout the 19th century.

That would immediately reduce the number of Americans represented by the average member by a quarter, yet the resulting House would still be a manageable size — smaller, for instance, than Britain’s 650-member House of Commons. Such an increase (that would modestly add new seats without taking away existing ones every decade) could plausibly appeal to the existing Congress, which would have to enact it.


Thursday, May 27, 2021

Counting Students and Prisoners

 Paul Mitchell at The Redistricting Report notes that the Census Bureau needed to count college students just as the pandemic emptied campuses.

It appeared to be a problem, but the Census Bureau assured college students they’d be all counted together at their respective campuses through a process called Group Quarters whereby the bureau receives manual tallies of the populations of college dormitories, nursing homes, and prisons based on the records kept for those facilities instead of direct interviews with the census enumerators or self-responses. You can really geek out on how this process is performed by reading the Census Bureau’s blogpost about it.

And for many this was confusing. What if a student was living off campus, not in the dorms? Would they be counted in the group-quarters or would they have to report themselves as living in their off-campus apartment? What if their parents already put them on their census form – would they be in trouble if they got double-counted? This was something that colleges were email blasting students about as they wanted them to report as living in their college community.

The census has a process for de-duplicating in a case where someone is accidentally, or purposefully reported being in two places at once. They also have processes for imputing populations where there was no reporting at all – which could have been significant in a once-bustling college town that turned into a ghost town overnight.

And that’s where the Republican lawsuit comes in. The GOP harbors some doubt about how those headcounts were arrived at and they’re suing to find out exactly how the Census arrived at the numbers of students who will be counted at college campuses, which often carry significant heft in the drawing of electoral districts.
...

Similarly, in the increasing number of states like California that are confronting the “prison gerrymander,” Group Quarters plays a part as well. These states are planning to count prison inmates in the communities they resided in at the time of arrest instead of where they were incarcerated on April 1. For California, that’s an estimated 116,000 people statewide that would be removed from the headcounts in the largely rural communities in the Central Valley and desert communities, depleting them of that redistricting currency in the upcoming redraw. A higher prison imputation by the Census Bureau in Kings County’s prison facilities, for example, means that county will have that many more individuals removed from their population base in the maps drawn for Congress, Assembly, and Senate.

Tuesday, April 27, 2021

Apportionment and Population

From the Census Bureau:
The U.S. Census Bureau announced today that the 2020 Census shows the resident population of the United States on April 1, 2020, was 331,449,281.

The U.S. resident population represents the total number of people living in the 50 states and the District of Columbia. The resident population increased by 22,703,743 or 7.4% from 308,745,538 in 2010.
...

The new resident population statistics for the United States, each of the 50 states, the District of Columbia and Puerto Rico are available on census.gov.
  • The most populous state was California (39,538,223); the least populous was Wyoming (576,851).
  • The state that gained the most numerically since the 2010 Census was Texas (up 3,999,944 to 29,145,505).
  • The fastest-growing state since the 2010 Census was Utah (up 18.4% to 3,271,616).
  • Puerto Rico's resident population was 3,285,874, down 11.8% from 3,725,789 in the 2010 Census.
In addition to these newly released statistics, today Secretary Raimondo delivered to President Biden the population counts to be used for apportioning the seats in the U.S. House of Representatives. In accordance with Title 2 of the U.S. Code, a congressionally defined formula is applied to the apportionment population to distribute the 435 seats in the U.S. House of Representatives among the states.

The apportionment population consists of the resident population of the 50 states, plus the overseas military and federal civilian employees and their dependents living with them overseas who could be allocated to a home state. The populations of the District of Columbia and Puerto Rico are excluded from the apportionment population because they do not have voting seats in Congress. The counts of overseas federal employees (and their dependents) are used for apportionment purposes only.

After the 1790 Census, each member of the House represented about 34,000 residents. Since then, the House has more than quadrupled in size (from 105 to 435 seats), and each member will represent an average of 761,169 people based on the 2020 Census.

Texas will gain two seats in the House of Representatives, five states will gain one seat each (Colorado, Florida, Montana, North Carolina, and Oregon), seven states will lose one seat each (California, Illinois, Michigan, New York, Ohio, Pennsylvania, and West Virginia), and the remaining states’ number of seats will not change based on the 2020 Census.

Upon receipt of the apportionment counts, the president will transmit them to the 117th Congress. The reapportioned Congress will be the 118th, which convenes in January 2023.

“Our work doesn’t stop here,” added acting Director Jarmin. “Now that the apportionment counts are delivered, we will begin the additional activities needed to create and deliver the redistricting data that were previously delayed due to COVID-19.”

Redistricting data include the local area counts states need to redraw or “redistrict” legislative boundaries. Due to modifications to processing activities, COVID-19 data collections delays, and the Census Bureau’s obligation to provide high-quality data, states are expected to receive redistricting data by August 16, and the full redistricting data with toolkits for ease of use will be delivered by September 30. The Census Bureau will notify the public prior to releasing the data.

Wednesday, March 31, 2021

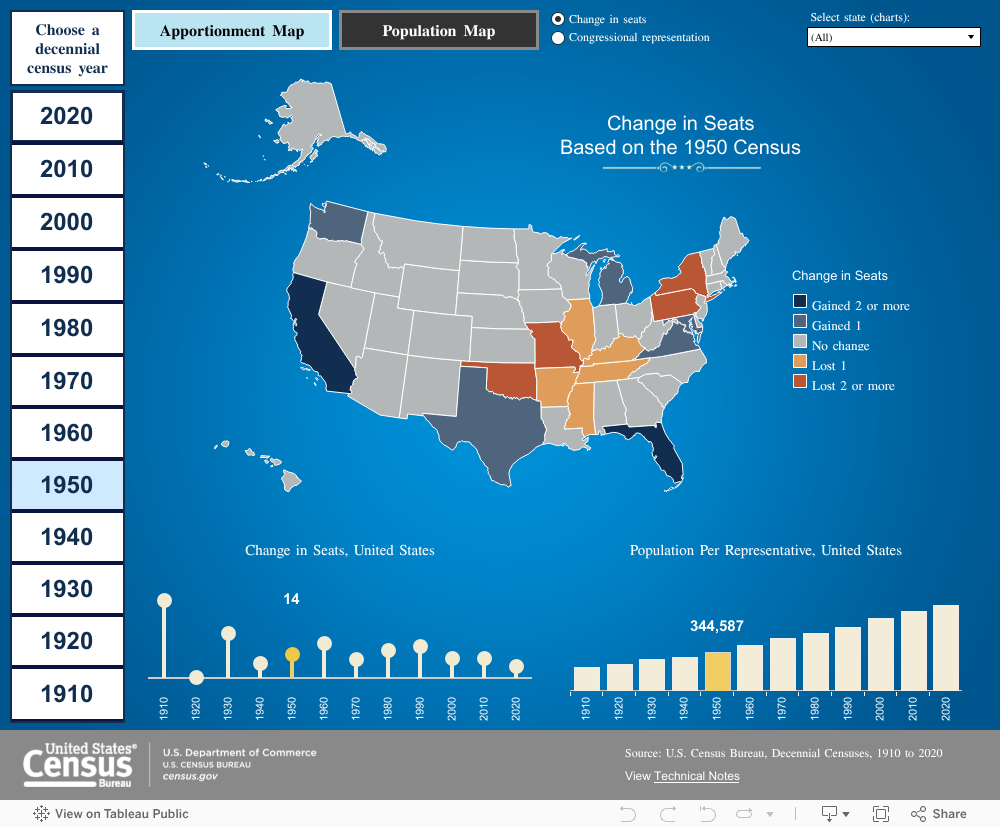
Historical Apportionment Map

The U.S. Census Bureau reported last week on a new online map today ahead of the 2020 Census apportionment results release. 
The “Historical Apportionment Data Map” currently displays apportionment results for each census from 1910 to 2010. 2020 Census apportionment results will be added to the map as they become available.

Apportionment is the process of dividing the 435 memberships, or seats, in the U.S. House of Representatives among the 50 states based on the apportionment population counts from the decennial census. Article I, Section 2 of the U.S. Constitution requires that a census of the population be taken every 10 years to apportion seats in Congress.

The interactive map includes the following types of data for each census from 1910 to 2010:
  • Number of seats in the U.S. House of Representatives.
  • Changes to each state’s number of seats in the U.S. House of Representatives.
  • Population per representative for each state.
  • Resident population of each state.
  • Percentage change in resident population for each state.
  • Population density of each state.

The interactive map also features:
  • Downloadable tables showing the source data.
  • Technical documentation.
  • Optimization for mobile use.
The apportionment population count includes the resident population of the 50 states, plus the overseas federal employees (military and civilian) and their dependents living with them who could be allocated to their home states. The population of the District of Columbia is not included in the apportionment population because it does not have any voting seats in the U.S. House of Representatives. 

Tuesday, December 24, 2019

Slow-Growing California

Julia Barajas and Sarah Parvini at LAT:
The number of Californians increased to 39.96 million, with new data from the Department of Finance showing mostly downward trends.
They are rooted in fewer births, coupled with increased deaths among an aging population. The Golden State, however, has also seen changes in international migration, along with more and more residents leaving the state. 
The estimates, which indicate that California’s population grew by 141,300 people between July 1, 2018, and July 1, 2019, nonetheless signal a 0.35% growth rate, “down from 0.57% for the prior 12 months — the two lowest recorded growth rates since 1900,” department officials underscored.
According to the agency, natural increase (with 452,200 births and 271,400 deaths) accounted for an additional 180,800 people to the state. Still, these gains were offset by losses in net migration — that is, the total amount of people moving into the state minus the total amount of people moving out. Notably, said Eddie Hunsinger, a demographer with the Department of Finance, even though the net international migration added to the state’s population, there was substantial negative domestic net migration, which resulted in a loss of 39,500 residents. This, said the department, marks “the first time since the 2010 census that California has had more people leaving the state than moving in from abroad or other states.” 
William Frey, a senior fellow at the Brookings Institution, said Friday’s findings follow a trend that demographers have seen over several years. While California has always seen domestic outmigration — people moving to other states — the rate has grown over the last decade.

Saturday, December 22, 2018

Population Gainers and Losers

From the Census:
The U.S. population grew by 0.6 percent and Nevada and Idaho were the nation’s fastest-growing states between July 1, 2017, and July 1, 2018. Both states’ populations increased by about 2.1 percent in the last year alone. Following Nevada and Idaho for the largest percentage increases in population were Utah (1.9 percent), Arizona (1.7 percent), and Florida and Washington (1.5 percent each).
Washington, D.C., reached a population of 702,455 in July 2018, surpassing 700,000 for the first time since 1975, according to the U.S. Census Bureau’s national and state population estimates released today. The change is due primarily to an influx of people from other parts of the country that began early in the decade. While the increase has begun to slow, the District of Columbia still grew by almost 1 percent last year.

Population declines were also common, with losses occurring in nine states and Puerto Rico. The nine states that lost population last year were New York (down 48,510), Illinois (45,116), West Virginia (11,216), Louisiana (10,840), Hawaii (3,712), Mississippi (3,133), Alaska (2,348), Connecticut (1,215) and Wyoming (1,197).
From Election Data Services:

New Census Bureau population estimates for 2018 released today shows a change of one more seat between two states from last year’s study generated by Election Data Services, Inc. on which states would gain or lose congressional seats if the current numbers were used for apportionment in 2018. But projecting these numbers to 2020, using several different methods, leads to more states being impacted by the decennial census scheduled to take place in just two years. These numbers will also be impacted by financial considerations being debated in the states, as well as in Congress as Commerce Department and Census Bureau appropriations hang in the balance of the government “shut-down” debate this week.
The Bureau’s 2018 total population estimates shows that now 13 states will be impacted by changes in their congressional delegation if these new numbers were used for apportionment today. The state of Arizona joins the previously indicated states of Colorado, Florida, North Carolina, and Oregon to each gain a single seat while the state of Texas is now shown to gain a second seat with the new data. The states of Rhode Island join the states of Illinois, Michigan, Minnesota, New York, Pennsylvania and West Virginia to lose a seat in Congress using the new data.

Wednesday, January 10, 2018

Citizenship and the Census

At Fox and Hounds, Tony Quinn discusses a US Justice Department request to the Census Bureau to add a citizenship question to the 2010 census.
Democrats oppose adding this question to the census because they suspect, with good reason, that non-citizens, especially illegal alien non-citizens, will simply refuse to be counted in the census rather than reveal their citizenship status.

This may also be a problem for legal immigrants, those in the United States on a visa or green card, because people do overstay their visas; a large percentage of the illegal population in America came in legally and has simply overstayed their visa. So the fear of Democratic and liberal groups is probably very well founded; certain few illegal persons are going to want to admit it on a census form and many legal immigrants may skip the census as well.

If millions of non-citizens refuse to participate in the US Census, the Democrats will take massive political beating. That’s because electoral districts must be drawn based on population. The non-citizen population resides in heavily Democratic areas; if they are not counted, those areas will not have sufficient population to support Democratic congressional and legislative districts, especially in the big cities. Democrats could lose dozens of districts just due to too few people being counted.
...
Early in our history the census began asking a whether the individual being enumerated was born in the United States. After the Civil War, with the huge boom in European migration, the census asked whether the person was a citizen eligible to vote. Beginning in 1880, the census asked the place of birth not only of the enumerated person but of the parents as well.

With the 1890 census the question was asked: are you a naturalized citizen or not. The year of immigration of a foreign born person as well as the year of naturalization (if naturalized) was asked in the 1900, 1910, 1920, 1930, 1940 and 1950 censuses, in other words for the first half of the 20th Century.

However, in 1960 the question was dropped and the Census Bureau explained why: the great migration had long since ended; very few non-citizens lived in the United States so the question was no longer relevant.

Wednesday, May 27, 2015

One Person, One Vote

Lyle Denniston reports at SCOTUSblog:
The Constitution has been understood for the past half-century to require that no individual’s vote count more at election time than anyone else’s. The Supreme Court agreed on Tuesday, for the first time, to clarify how that concept of equality is to be measured, when legislatures are drawing up election districts.
 The Court took on a case challenging the 2011 redistricting of the thirty-one seats in the Texas Senate, focusing on what measure of population should be used to judge whether the “one-person, one-vote” mandate has been met. That mandate originated in Reynolds v. Sims in 1964. The new case of Evenwel v. Abbott will be heard and decided next Term, as will two new criminal cases the Justices also agreed on Tuesday to hear.
...
The Justices’ move into the Texas Senate redistricting case comes fourteen years after Justice Clarence Thomas, in Chen v. City of Houston in May 2001, was the sole member of the Court who went on record in favor of sorting out “what measure of population should be used for determining whether the population is equally distributed among the districts.”
The usual choice considered by legislatures is to make districts more or less equal by dividing up shares of the state’s total population, or, as an alternative, to draw lines based upon some measure of the voting members of the population — such as the numbers actually registered to vote.
Two Texas voters, who wound up in state senate districts where they say their votes will count less than the votes in another district even though each of those districts has about the same total number of people, argued that this contradicts the “one-person, one-vote” guarantee of voter equality. Their votes would have counted equally, they contended, if the legislature instead had used voting-age population as the measure.
The voters, Sue Evenwel, who lives in Titus County in Senate District 1, and Edward Pfenninger, who lives in Montgomery County in District 4, said their votes were diluted because of the disparity between the two measures as applied to those districts, where more of the people vote proportionally. Both districts are rural. Other, more urban districts have proportionally fewer registered voters, so the redistricting plan based on actual population is said to give those who do vote more weight — that is, fewer of them can control the outcome.
“A statewide districting plan that distributes voters or potential voters in a grossly uneven way,” the two voters told the Court, “is patently unconstitutional under Reynolds v. Sims and its progeny.”
The voters do not argue that legislatures should be forbidden ever to use total population as the districting measure, but only when it results in the kind of disparity, compared to a plan based on voters’ numbers, that resulted in Texas.
At the theoretical core of this dispute is the theory of representation that a legislature should follow. Texas, supported by the lower court in the new cases, argued that this is a question of how to define democracy, a question that it said should be left to the people’s elected representatives, and not decided by the courts. The state also contended that the Supreme Court had said explicitly in a 1966 decision (Burns v. Richardson) that the choice of population measure was a matter for legislatures.

Tuesday, December 23, 2014

Florida Surpasses New York

The Census reports:
By adding an average of 803 new residents each day between July 1, 2013 and July 1, 2014, Florida passed New York to become the nation’s third most populous state, according to U.S. Census Bureau state population estimates released today. Florida’s population grew by 293,000 over this period, reaching 19.9 million. The population of New York increased by 51,000 to 19.7 million. 
California remained the nation’s most populous state in 2014, with 38.8 million residents, followed by Texas, at 27.0 million. Although the list of the 10 most populous states overall was unchanged, two other states did change positions, as North Carolina moved past Michigan to take the ninth spot. 
Another milestone took place in Georgia (ranked 8th), which saw its population surpass 10 million for the first time. 
North Dakota was the nation’s fastest-growing state over the last year. Its population increased 2.2 percent, followed by the 1.7 percent growth in Nevada and Texas. Each of the 10 fastest-growing states was in the South or West with the exception of North Dakota.  
Six states lost population between July 1, 2013, and July 1, 2014: Illinois (9,972 or -0.08 percent), West Virginia (3,269 or -0.18 percent), Connecticut (2,664 or -0.07 percent), New Mexico (1,323 or -0.06 percent, Alaska (527 or -0.07 percent) and Vermont (293 or -0.05 percent)..

Thursday, December 23, 2010

Enlarge the House?

David Freddoso expands on a problem that yesterday's post mentioned: unequal representation in the House. (For more on the topic, see (www.apportionment.us and www.thirty-thousand.org). One solution, he says, is to enlarge the chamber's membership by 100:
It's probably a really good idea to add more seats, given that each member of a 435-man Congress is representing, on average, more than 700,000 constituents, whereas originally, the target was about 30,000 constituents per member. In Federalist Number 55, James Madison discussed the dangers of both a too-large Congress and a too-small one:

Sixty or seventy men may be more properly trusted with a given degree of power than six or seven. But it does not follow that six or seven hundred would be proportionably a better depositary. And if we carry on the supposition to six or seven thousand, the whole reasoning ought to be reversed. The truth is, that in all cases a certain number at least seems to be necessary to secure the benefits of free consultation and discussion, and to guard against too easy a combination for improper purposes; as, on the other hand, the number ought at most to be kept within a certain limit, in order to avoid the confusion and intemperance of a multitude. In all very numerous assemblies, of whatever character composed, passion never fails to wrest the sceptre from reason. Had every Athenian citizen been a Socrates, every Athenian assembly would still have been a mob.

One interesting idea, mentioned in a Wikipedia stub but barely anywhere else, is the so-called "Wyoming Rule," which proposes to add districts until the smallest single-district state (population 568,000) is not so badly over-represented. As it happens, you can get pretty close to that number (average 579,000) by adding exactly 100 districts.

...

The most underrepresented state in the House right now is Montana, where 994,000 people share a single congressman. If you added 100 seats to the Congress, Montanans would gain one seat and 63% percent more representation in Congress. Californians would lose a small amount of congressional clout.

Other small states like Alaska and South Dakota would suffer in a 535-member House. By the very nature of the process, small states are the most likely to win or lose big in reapportionment. The question of who wins or loses (Delaware, say, or South Dakota?) is really a random one, depending less on the mean population of the districts than on the exact point at which you stop awarding new seats. In this case, South Dakota would get the 536th seat, and ends up being the big loser. No matter how many seats you add, Someone is always going to be on the cusp of getting a new one, and they're the ones most likely to lose or gain.

The only solution to representational inequity is to abolish statehood -- something that cannot be done under the Constitution without the assent of all 50 state legislatures. Another would be to make Congress unreasonably large.


Wednesday, December 22, 2010

Not Quite One Person, One Vote

Yesterday, the Census announced population figures for 2010. These data determine how many seats each state gets in the US House. The official Census video on reapportionment says that the process " ensures that each congressional district, from Maryland to California, has roughly the same number of people."

That is not really true.

As we point out in the chapter on campaigns and elections (p. 332), the principle of "one person, one vote" means that all districts within a state should have equal population. But this standard does not rule out variations among states. Under the Constitution, every state gets at least one representative, and fractional voting is not possible, so disparities are inevitable. Under the 2010 data, for instance, Montana's one House member will represent 994,416 people, while each of Rhode Island's two representatives will represent 527,624.


NUMBER OF

RESIDENTS

APPORTIONMENT

REPRESENTATIVES

PER SEAT

POPULATION

BASED ON

STATE

(APRIL 1, 2010)

2010 CENSUS

Montana

994416

1

994416

Delaware

900877

1

900877

South Dakota

819761

1

819761

Idaho

1573499

2

786750

Oregon

3848606

5

769721

Iowa

3053787

4

763447

Louisiana

4553962

6

758994

Oklahoma

3764882

5

752976

Missouri

6011478

8

751435

Mississippi

2978240

4

744560

North Carolina

9565781

13

735829

New Jersey

8807501

12

733958

Arkansas

2926229

4

731557

Virginia

8037736

11

730703

Massachusetts

6559644

9

728849

Kentucky

4350606

6

725101

Maryland

5789929

8

723741

Ohio

11568495

16

723031

Indiana

6501582

9

722398

Alaska

721523

1

721523

Colorado

5044930

7

720704

New York

19421055

27

719298

Connecticut

3581628

5

716326

Kansas

2863813

4

715953

Illinois

12864380

18

714688

Arizona

6412700

9

712522

Wisconsin

5698230

8

712279

USA

309183463

435

710767

Tennessee

6375431

9

708381

Michigan

9911626

14

707973

Pennsylvania

12734905

18

707495

California

37341989

53

704566

Texas

25268418

36

701901

Florida

18900773

27

700029

Georgia

9727566

14

694826

Utah

2770765

4

692691

New Mexico

2067273

3

689091

Alabama

4802982

7

686140

Hawaii

1366862

2

683431

Nevada

2709432

4

677358

North Dakota

675905

1

675905

Washington

6753369

10

675337

Maine

1333074

2

666537

Minnesota

5314879

8

664360

South Carolina

4645975

7

663711

New Hampshire

1321445

2

660723

Vermont

630337

1

630337

West Virginia

1859815

3

619938

Nebraska

1831825

3

610608

Wyoming

568300

1

568300

Rhode Island

1055247

2

527624