Search This Blog

Showing posts with label Wyoming. Show all posts

Monday, September 11, 2023

Sticky States


The share of people born in a state and who stay there can provide an important measure of its attractiveness to workers. The stickiness of native residents is also key to maintaining a stable (or growing) population and workforce, which is vital to economic growth.

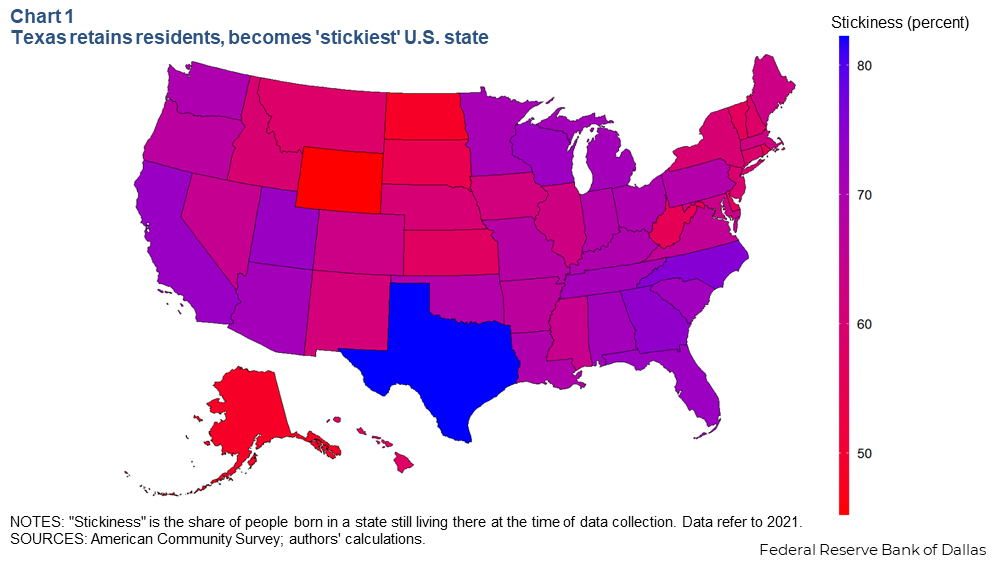
To figure out which states are best at retaining their native residents, we calculated the stickiness of each state. Using American Community Survey (ACS) data, we estimated the share of people born in each state who still lived in that state as of the 2021 survey (Chart 1).

Chart 1

Downloadable chart | Chart data

Texas is the stickiest state in the country by far, with approximately 82 percent of native Texans still living here in 2021. Other sticky states include North Carolina (75.5 percent), Georgia (74.2 percent), California (73.0 percent) and Utah (72.9 percent).

At the other end of the spectrum, Wyoming is the least-sticky state, with only 45.2 percent of natives remaining there. North Dakota and Alaska were the only other states with less than half their native population staying there (48.6 percent and 48.7 percent, respectively). Rhode Island (55.2 percent) and South Dakota (54.2 percent) round out the bottom five.

Notably, the least-sticky states tend to see high levels of outmigration of everyone—not just their native residents (Chart 2).Downloadable chart | Chart data


Overall outmigration numbers track everyone moving from one state to another state, including both people born there and those who moved there before leaving, making them a better indicator of population flows.

In addition to being the stickiest state, Texas had the lowest outmigration rate in 2021, followed by Maine and Michigan. Wyoming, Alaska and Hawaii experienced the highest outmigration rates.

Tuesday, April 27, 2021

Apportionment and Population

From the Census Bureau:
The U.S. Census Bureau announced today that the 2020 Census shows the resident population of the United States on April 1, 2020, was 331,449,281.

The U.S. resident population represents the total number of people living in the 50 states and the District of Columbia. The resident population increased by 22,703,743 or 7.4% from 308,745,538 in 2010.
...

The new resident population statistics for the United States, each of the 50 states, the District of Columbia and Puerto Rico are available on census.gov.
  • The most populous state was California (39,538,223); the least populous was Wyoming (576,851).
  • The state that gained the most numerically since the 2010 Census was Texas (up 3,999,944 to 29,145,505).
  • The fastest-growing state since the 2010 Census was Utah (up 18.4% to 3,271,616).
  • Puerto Rico's resident population was 3,285,874, down 11.8% from 3,725,789 in the 2010 Census.
In addition to these newly released statistics, today Secretary Raimondo delivered to President Biden the population counts to be used for apportioning the seats in the U.S. House of Representatives. In accordance with Title 2 of the U.S. Code, a congressionally defined formula is applied to the apportionment population to distribute the 435 seats in the U.S. House of Representatives among the states.

The apportionment population consists of the resident population of the 50 states, plus the overseas military and federal civilian employees and their dependents living with them overseas who could be allocated to a home state. The populations of the District of Columbia and Puerto Rico are excluded from the apportionment population because they do not have voting seats in Congress. The counts of overseas federal employees (and their dependents) are used for apportionment purposes only.

After the 1790 Census, each member of the House represented about 34,000 residents. Since then, the House has more than quadrupled in size (from 105 to 435 seats), and each member will represent an average of 761,169 people based on the 2020 Census.

Texas will gain two seats in the House of Representatives, five states will gain one seat each (Colorado, Florida, Montana, North Carolina, and Oregon), seven states will lose one seat each (California, Illinois, Michigan, New York, Ohio, Pennsylvania, and West Virginia), and the remaining states’ number of seats will not change based on the 2020 Census.

Upon receipt of the apportionment counts, the president will transmit them to the 117th Congress. The reapportioned Congress will be the 118th, which convenes in January 2023.

“Our work doesn’t stop here,” added acting Director Jarmin. “Now that the apportionment counts are delivered, we will begin the additional activities needed to create and deliver the redistricting data that were previously delayed due to COVID-19.”

Redistricting data include the local area counts states need to redraw or “redistrict” legislative boundaries. Due to modifications to processing activities, COVID-19 data collections delays, and the Census Bureau’s obligation to provide high-quality data, states are expected to receive redistricting data by August 16, and the full redistricting data with toolkits for ease of use will be delivered by September 30. The Census Bureau will notify the public prior to releasing the data.

Wednesday, March 25, 2020

Social Distancing

Lydia Saad at Gallup:
Americans this past weekend stepped up their already considerable efforts to engage in social distancing in response to the novel coronavirus. Seventy-two percent of U.S. adults now say they are avoiding public places like stores and restaurants, well ahead of the 54% reporting this last week. Nearly as many (68%) are forgoing small gatherings of friends and family, up from 46%.
These shifts are notable because they suggest that the unprecedented efforts by federal, state, local and private-sector leaders to get the public's attention -- a combination of formal closures of transportation, schools, and workplaces, as well as public appeals for voluntary efforts -- are working.
Even larger percentages of Americans are avoiding events with large crowds (92%) and are staying away from air travel or mass transit (87%). Most Americans were already avoiding these activities last week as businesses en masse began shuttering their doors, and widespread government and corporate travel bans took hold.

Geoffrey Fowler at WP:
If you have a smartphone, you’re probably contributing to a massive coronavirus surveillance system.
And it’s revealing where Americans have — and haven’t — been practicing social distancing.
On Tuesday, a company called Unacast that collects and analyzes phone GPS location data launched a “Social Distancing Scoreboard” that grades, county by county, which residents are changing behavior at the urging of health officials. It uses the reduction in the total distance we travel as a rough index for whether we’re staying put at home.

Comparing the nation’s mass movements from March 20 to an average Friday, Washington, D.C., gets an A, while Wyoming as a whole earns an F.
Of course, it is not completely fair to compare a big, densely-populated city to a very rural state where one must often drive many miles just to get gas or groceries.