Religion and Civic Participation
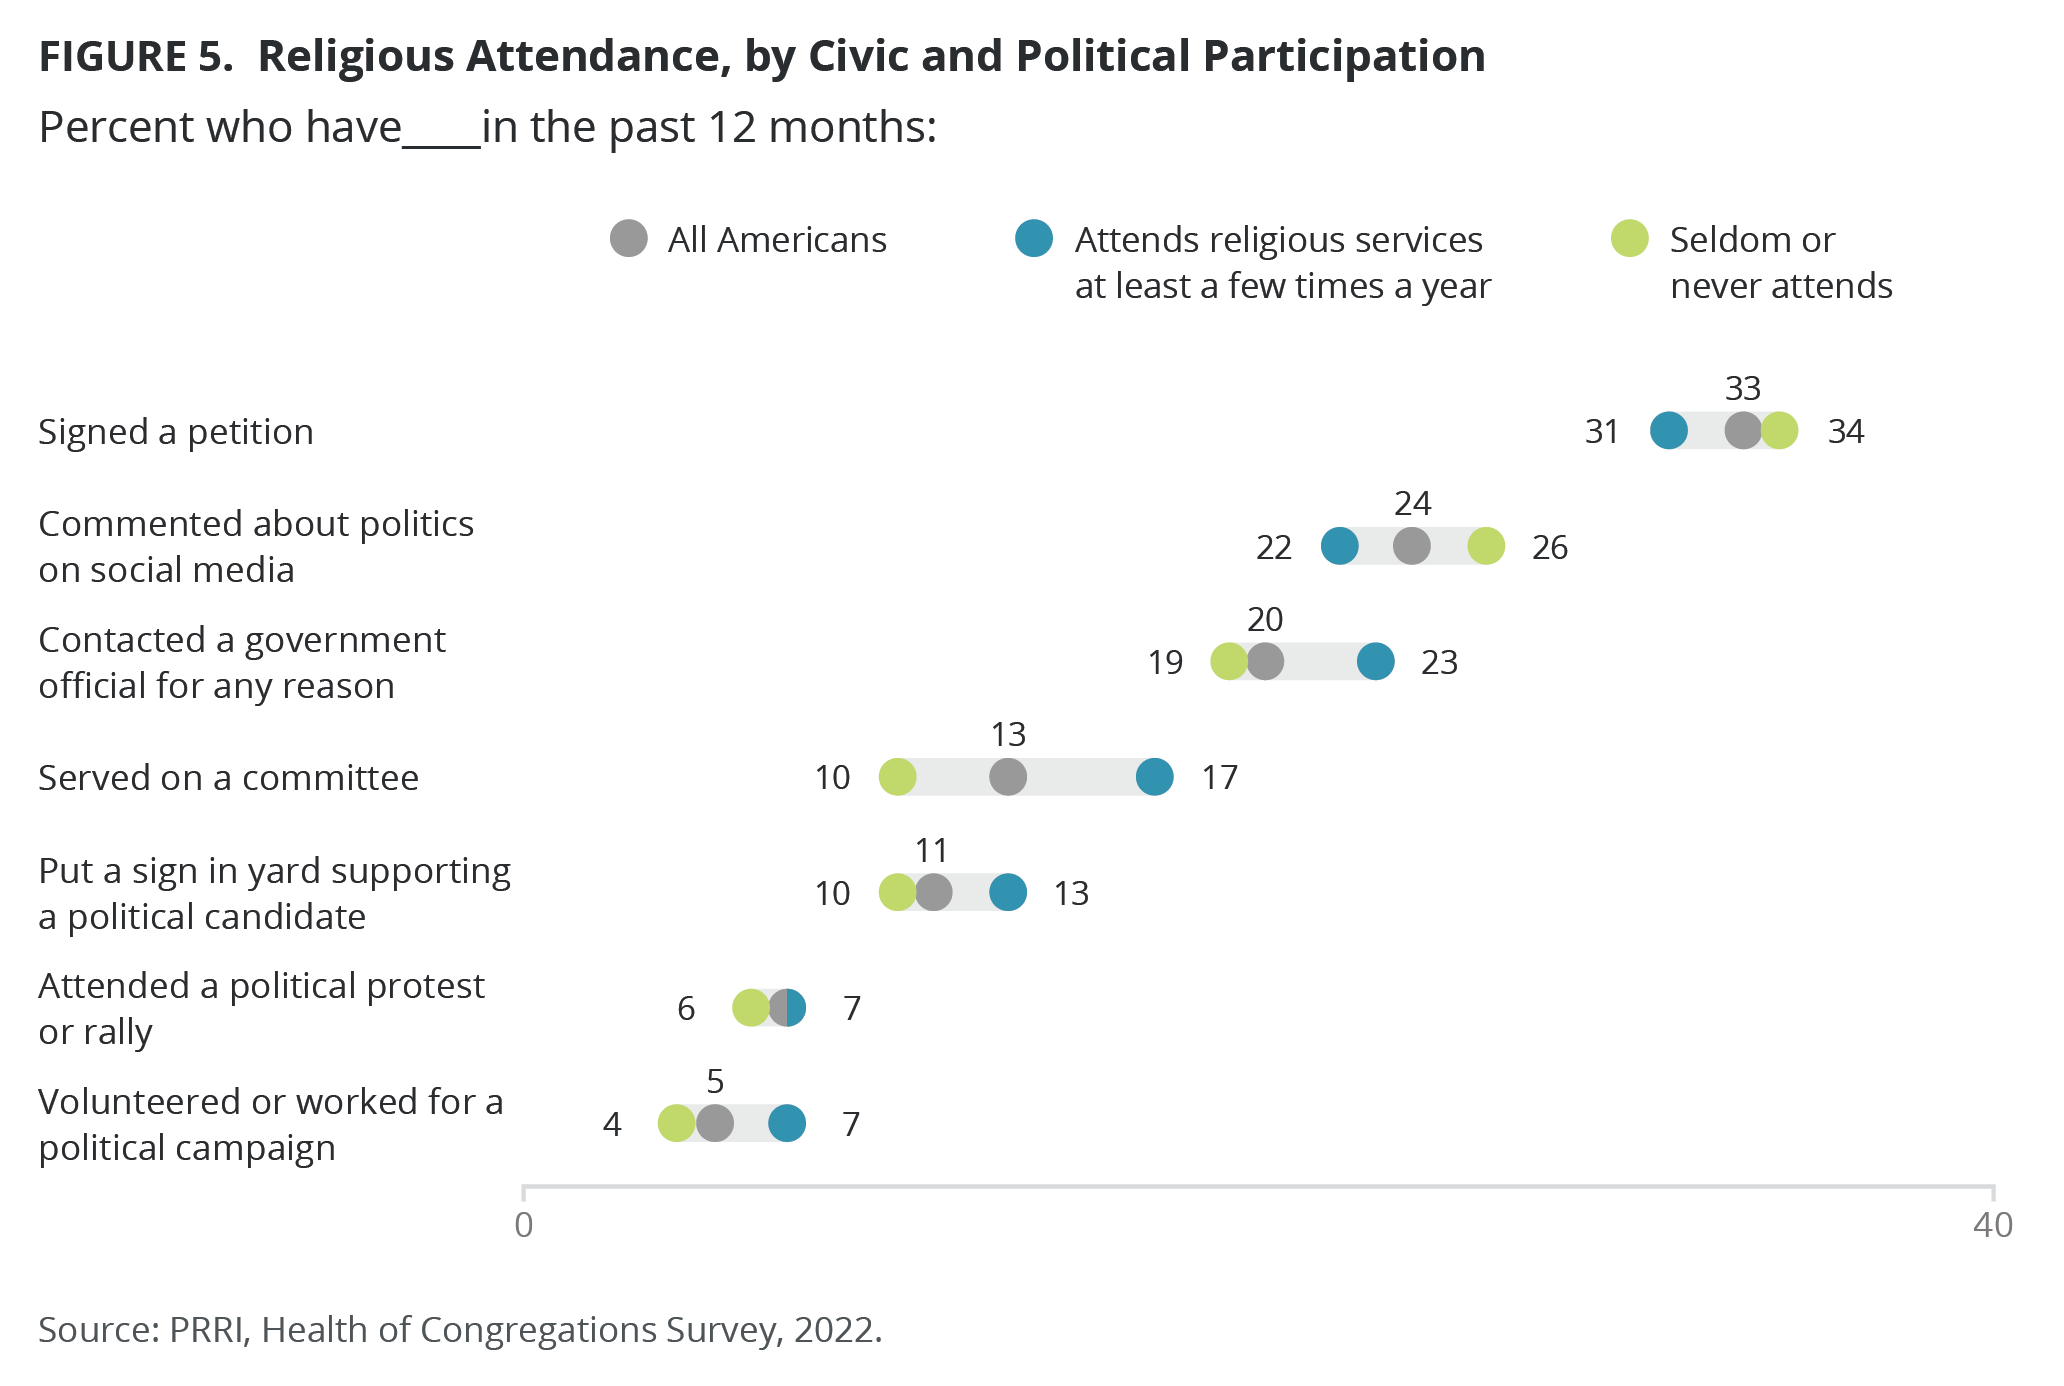
From PRRI:When asked about their civic and political participation in the past year, one-third of Americans (33%) said they signed a petition either in person or online; 24% said they commented about politics on a message board or internet site, including social media; 20% said they contacted a government official; 13% said they served on a committee for a civic, nonprofit, or community organization or event; 11% said they put a sign in their yard or a bumper sticker on their car supporting a candidate for political office; 7% said they attended a political protest or rally; and just 5% said they volunteered or worked for a political campaign.
Americans who attend church at least a few times a year are notably more likely than those who seldom or never attend church to have contacted a government official (23% vs. 19%), served on a committee (17% vs. 10%), put up a sign supporting a political candidate (13% vs. 10%), or volunteered for a political campaign (7% vs. 4%). By contrast, Americans who attend church more frequently are less likely than those who seldom or never attend to have commented about politics (22% vs. 26%).
White Americans participate in civic and political activities more than nonwhite Americans do. For example, white Americans are more likely to have signed a petition (35%) or contacted a government official (24%) than both Black Americans (29% and 15%, respectively) and Hispanic Americans (26% and 14%, respectively). White Americans are also more likely than Black Americans to have commented about politics (27% vs. 15%) and are more likely than Hispanic Americans to have served on a committee (14% vs. 10%) or put a sign in their yard supporting a candidate (12% vs 8%).
When examining religious attendance together with race and civic and political participation, white churchgoers are notably more likely than white non-churchgoers to have served on a committee (17% vs. 12%), but are less likely to have commented about politics (24% vs. 29%). Black churchgoers are more likely than Black non-churchgoers to have contacted a government official (20% vs. 11%), served on a committee (19% vs. 7%), or volunteered for a political campaign (9% vs. 3%). Hispanic churchgoers are also more likely than Hispanic non-churchgoers to have contacted a government official (20% vs. 11%), served on a committee (15% vs. 6%), or put up a sign supporting a candidate (12% vs. 5%). Churchgoers of other racial groups are more likely than non-churchgoers of other races to have served on a committee (20% vs. 7%) or volunteered for a political campaign (12% vs. 3%).[5]