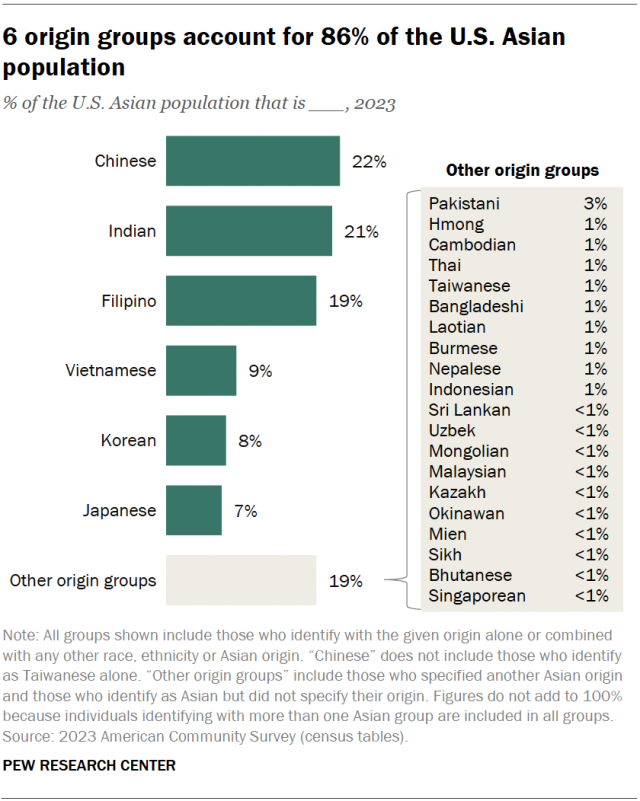
The U.S. Asian population has more than doubled since 2000. The number of Asian Americans grew from 11.9 million in 2000 to 24.8 million in 2023. Both the U.S.-born and immigrant populations increased significantly over this period.
The Asian share of the U.S. population overall increased from 4% to 7% during this time.
...
Immigrants are a declining share of the U.S. Asian population, though they remain a majority. In 2000, immigrants accounted for 63% of Asians overall, compared with 54% in 2023.
Most Asian origin groups have also seen declines in their shares of immigrants. Hmong had the sharpest drop, from 55% in 2000 to 31% in 2023. By contrast, the share of Thai who were immigrants had the smallest decrease, going from 78% to 74%.
...
California had the largest Asian population of any state in 2023, at around 7.1 million people. It was followed by New York and Texas (both 2 million), New Jersey (1 million), and Washington (990,000). More than half (54%) of the U.S. Asian population resides in these five states....
More than half of Asians ages 25 and older (56%) have a bachelor’s degree or more education. However, this varies widely by origin group. For example, 83% of Taiwanese have a bachelor’s degree or higher, whereas 18% of Laotians do.
Similar shares of U.S.-born and immigrant Asians ages 25 and older have at least a college degree (57% and 56%, respectively). Both figures are substantially higher than among all U.S.-born people and all U.S. immigrants with a college degree (36% and 35%, respectively).
