Search This Blog

Showing posts with label Romney. Show all posts

Sunday, August 26, 2018

Former Rivals on McCain


Monday, April 6, 2015

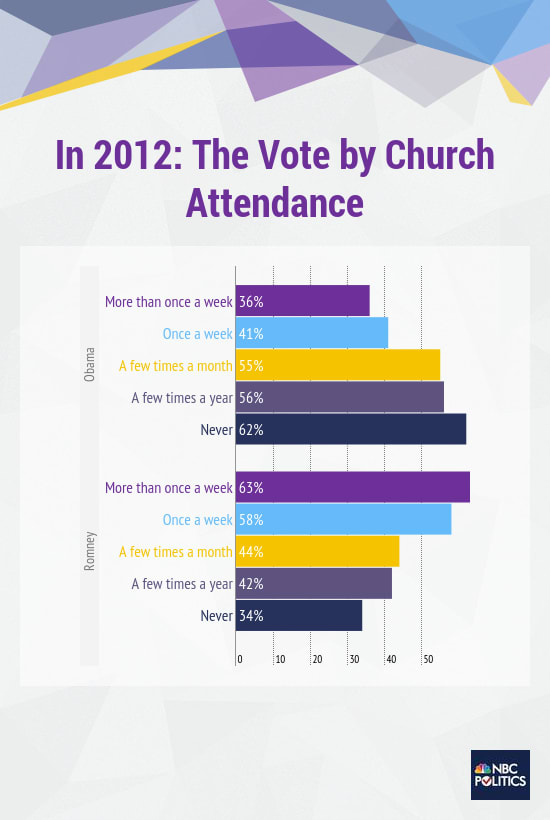
Church Attendance and Presidential Voting

At NBC, Dante Chinni writes:
There was a clear linear progression for both candidates in 2012, with Mr. Obama's support rising as church attendance falls and the opposite true for Mr. Romney.
The church attendance differences are most stark when you look at Catholics.
Yes, Mr. Obama won the overall Catholic vote in 2012, but Mr. Romney beat the president handily among Catholics who attended church at least weekly - 57% to 42%. In fact, those figures matched exactly the margins Mr. Romney had over Mr. Obama with Protestant Christians.
But among more casual Catholics, those who attend church less than once a week, Mr. Obama defeated Mr. Romney with similar ease - 56% to 42%. (There are similar differences among protestant voters, though Mr. Romney won both regular church attendees and less-frequent churchgoers.)

The message in these numbers? There will not only be more people in the pews around this weekend in your house of worship, there will probably be a different body politic.


Saturday, December 6, 2014

Obama, Romney, Twitter

At New Media and Society, Daniel Kreiss has an article titled Seizing the Moment: The
Presidential Campaigns’ Use of Twitter During the 2012 Electoral Cycle" [Also posted at Epic Journey]

The abstract:
Drawing on interviews with staffers from the 2012 Obama and Romney presidential campaigns and qualitative content analysis of their Twitter feeds, this article provides the first inside look at how staffers used the platform to influence the agendas and frames of professional journalists, as well as appeal to strong supporters. These campaigns sought to influence journalists in direct and indirect ways, and planned their strategic communication efforts around political events such as debates well in advance. Despite these similarities, staffers cite that Obama’s campaign had much greater ability to respond in real time to unfolding commentary around political events given an organizational structure that provided digital staffers with a high degree of autonomy. After analyzing the ways staffers discuss effective communication on the platform, this article argues that at extraordinary moments campaigns can exercise what Isaac Reed calls “performative power,” influence over other actors’ definitions of the situation and  their consequent actions through well-timed, resonant, and rhetorically effective  communicative action and interaction.
From the article:
The Romney campaign, by contrast, was organized very differently. The digital
department had a seat at the senior staff table, at the same level as political, policy,
operations, and finance. However, in contrast to the Obama campaign, Romney’s digitalteam had to go through an extensive vetting process for all of its public communications,meaning that the temporal workflow of the campaign did not match the speed of social media. As Caitlin Checkett (2014, personal communication), the campaign’s digital integration director, describes,
So whether it was a tweet, Facebook post, blog post, photo—anything you could imagine—it had to be sent around to everyone for approval. Towards the end of the campaign that was 22 individuals who had to approve it. … The digital team unfortunately did not have the opportunity to think of things on their own and post them. … The downfall of that of course is as fast as we are moving it can take a little bit of time to get that approval to happen.
Zac Moffatt (2014, personal communication), Romney’s digital director, went so far
as to describe the campaign as having “the best tweets ever written by 17 people … It
was the best they all could agree on every single time.” A number of staffers on the
Romney campaign cite that while the initial challenge of the campaign was resources
given an extended primary, in the long run it was the lack of organizational autonomy
that undermined digital efforts on behalf of the candidate. Without a large staff during the primaries, the challenge was producing the various types of rich digital content the
Obama campaign was producing (such as interviews with field volunteers and staffers). But the broader issue of the approval process meant that by the end of the campaign, even when it had staffed up considerably, staffers were often repackaging press releases across platforms because everyone knew they were approved. As Checkett (2014, personal communication) describes,
So you get into the cycle where a press release is sent to us, it is something that we can add to the site, you can pull a Facebook message from that, some Twitter copy, and you don’t have to go through the approval process because it was already approved. So I felt like that was a huge problem because of course people don’t want to go to your website and read press releases and we knew that.

Tuesday, April 1, 2014

Asian Americans, Affirmative Action, and Election Politics

Nearly 18 years ago, 61 percent of California’s Asian-American electorate opposed California’s Proposition 209, a statewide referendum, which barred race and ethnicity as considerations in state university admissions, government jobs and contracts. Notwithstanding, their opposition, Proposition 209 became law. Fast forward to March 2014, when California’s Asian-American community helped blunt an effort in the state’s legislature to gut the affirmative action ban. This recent pushback by California’s Asian-American community is a reminder that upward mobility attained can reshape attitudes, and that the interests of the so-called Coalition of the Ascendant are not monolithic. ...

If 2012 is any indication, don’t bet on the Republican Party going there. First, it is immigration—not affirmative action—that has captured the GOP’s attention. For all of Mitt Romney’s support for self-deportation, Romney actually backed affirmative action. Presented with an opportunity to voice opposition to government sanctioned racial preferences during the run-up to the Michigan and Ohio primaries, Romney balked.
Second, as [Stanford Prof. Neil] Malhotra described, opposition to affirmative action resonates with the identifiably upwardly mobile, and that is not where the Republicans’ white working class base is today. As Ross Douthat trenchantly writes: “Some of the most religious areas of the country—the Bible Belt, the deepest South—struggle mightily with poverty, poor health, political corruption and social disarray.” Immigration and competition for jobs come first there. College? If only. And as far as the GOP donor class goes, can you say legacies? After all is said and done, the squabble over affirmative action will most likely remain a low-key Democratic Party family feud, with the courts being called in from time-to-time to referee.

Tuesday, September 3, 2013

Twitter in the 2012 Campaign

A number of posts have discussed the role of Twitter in electoral politics.  At the Shorenstein Center of Harvard's Kennedy School, journalist Peter Hamby writes of the 2012 campaign:
When political news broke, Twitter was the place to find it. Top officials from the Obama and Romney campaigns would joust, publicly, via tweet. When news producers back in Washington and New York were deciding what to put on their shows, many looked first to their Twitter feeds.

Twitter is where that central conversation is taking place,” said Ben Smith of Buzzfeed. “It’s not that Twitter is where you’re discussing the news. So much of it is actually happening on Twitter. It was just the central stream of the conversation for everyone.”

Jonathan Martin of The New York Times, who uses the service to share news, tweet political trivia and swap food tips with other frequent travelers, agrees.

“It’s the gathering spot, it’s the filing center, it’s the hotel bar, it’s the press conference itself all in one,” said Martin. “It’s the central gathering place now for the political class during campaigns but even after campaigns. It’s even more than that. It’s become the real-time political wire. That’s where you see a lot of breaking news. That’s where a lot of judgments are made about political events, good, bad or otherwise.”

...
John Dickerson, hardly a new media curmudgeon, called Twitter “a mess for campaign coverage.”
“It makes us small and it makes us pissed off and mean, because Twitter as a conversation is incredibly acerbic and cynical and we don’t need more of that in coverage of politics, we need less,” he said.
Dickerson’s assertion is backed up by Pew, which monitored the tone the campaign conversation on various media platforms during the race. Twitter was far and away “the most negative” of all the platforms studied, the study found—more than cable news, blogs, newspapers or Facebook.

“The overall negativity on Twitter over the course of the campaign stood out,” Pew noted in a subsequent study. “For both candidates, negative comments exceeded positive comments by a wide margin throughout the fall campaign season.”

Thursday, May 2, 2013

After Hope and Change

A May 1 discussion at Heritage:
The 2012 elections were, by all accounts, a turning point in American politics.  President Obama and challenger Mitt Romney fought a grueling ground-war for the hearts and minds of American voters.  Demographic shifts, the skyward rise of social media's political relevance and shocking developments on shores both foreign and domestic ultimately led Barack Obama back to the White House for a second term.  In After Hope and Change: The 2012 Elections and American Politics, noted political scientist James Ceaser and his co-authors offer a comprehensive account of the national election, including the presidential nomination process and election and congressional elections.  The new status quo after 2012 includes a more active federal government and a more divided America.  What does American politics look like after hope and change?  How should conservatism respond to the lessons of the 2012 election?
James W. Ceaser is Professor of Politics at the University of Virginia, where he has taught since 1976.  He has written several books on American politics and political thought, including Presidential Selection, Reconstructing America, and Nature and History in American Political Development. He is co-author, along with Andrew E. Busch and John J. Pitney Jr., of After Hope and Change: The 2012 Elections and American Politics and Epic Journey: The 2008 Elections and American Politics.  Henry Olsen, Director of AEI's National Research Initiative, studies and writes about the policy and political implications of long-term trends in social, economic, and political thought.  Michael Franc, Vice President of Government Studies at The Heritage Foundation, oversees Heritage’s outreach to Capitol Hill and the Executive Branch.


Tuesday, March 19, 2013

The RNC Report, the Hispanic Vote, and the 2004 Election


Recents posts have discussed the RNC report on the state of the Republican Party.  At one point, the report makes a claim about the 2004 election:
President George W. Bush used to say, "Family values don't stop at the Rio Grande and a hungry mother is going to try to feed her child." When Hispanics heard that, they knew he cared and were willing to listen to his policies on education, jobs, spending, etc. Because his first sentence struck a chord, Hispanic Americans were willing to listen to his second sentence. We heard this from other demographic groups as well. President Bush got 44 percent of the Hispanic vote, a modern-day record for a Republican presidential candidate.
The 44 percent figures comes from a national exit poll. But there is reason to think that this poll overstated Bush's Hispanic support.  In 2005, the Pew Hispanic Center reported:
The controversy grew more complex when Ana Maria Arumi, a polling specialist then of NBC, which was a member of the NEP consortium, offered fresh insight on the exit poll at an event hosted by the National Association of Hispanic Journalists (NAHJ) on December 2, 2004, and in a brief news item about the event on MSNBC.COM. Arumi said that the selection of sample precincts in the NEP produced an overrepresentation of Cuban respondents in Miami-Dade County, a population that is typically the most pro-Republican segment of the Hispanic electorate. A better assessment of the Hispanic vote, she said, could be developed by aggregating exit polls conducted individually in the 50 states and the District of Columbia. That analysis showed that Bush had drawn 40 percent of the Hispanic votes, she said. Arumi’s comments appear to be the most extensive analysis of the state exit poll findings regarding the Hispanic vote that have been made public by members of the NEP consortium. Full data from both the national and the 51 state polls has become publicly available, and in conjunction with data from the CPS it is now possible to assess these findings.

The national exit poll was based on a sample of 250 precincts designed to be representative of the nation as a whole, and 1,037 respondents at those precincts identified themselves as Hispanics. At the same time as the national poll was being conducted on election day, the NEP was also conducting 51 individual polls designed to produce results representative in each of the 50 states and the District of Columbia. These polls were taken at 1,469 precincts at which 4,469 Hispanics were interviewed. The Pew Hispanic Center has aggregated data from the 51 state polls and weighted the results to produce results for the nation as a whole. As Arumi noted, the 51 state polls show that Bush drew 40 percent of the Hispanic vote rather than the 44 percent in the national poll.
David Leal and colleagues wrote in "The Latino Vote in the 2004 Election" (PS:  Political Science and Politics 38 (January 2005): 41-49):

We conclude that the pre-election data provide little evidence that President Bush received the 44% level of support from Latinos estimated by the 2004 exit polls. We examined 10 such surveys and found Latino support averaging 60% for Kerry and 32 percent for Bush—which is the traditional two-to-one ratio of support enjoyed by the Democratic Party. Support for Kerry and Bush was large and found within almost every standard Latino demographic. Equally problematic is the lack of movement over time for Bush in these surveys. In addition, two surveys by the Washington Post/Univision/TRPI in both July and October found a 60–30 split, and Latinos were generally more likely to identify as Democrats (66%) than Republicans (24%).
...
Evidence from Texas counties and urban precincts also calls into question the exit poll claim that Bush achieved 59% of the Latino vote in his home state, which in turn suggests there may be problems with the national Latino exit poll data. Given these consistent patterns, it seems more logical to conclude that the exit polls mistakenly depicted the Latino vote than to accept that Latino preferences could have changed so substantially in such a short period.
Moreover, National Annenberg Election Survey put the Bush figure at 41 percent.

Clearly, Bush's 2004 showing among Hispanics surely was much higher than Romney's 27 percent. So why hype it by citing an inaccurate number?


Friday, January 4, 2013

President Obama's Popular Vote


A November 20 post provided some historical perspective on the 2012 popular vote for president. At the time, however, more  than a million ballots were outstanding.  Now, all states and the District of Columbia have certified the final results:
  • Obama:  65,899,557 (51.06%)
  • Romney: 60,931,959 (47.21%)

The table below ranks winners since 1896 by share of popular vote.  The preliminary data placed him 20th of 30, but his percentage increased slightly as the final votes came in, so now he ranks 18th of 30.

1
1964
Lyndon B. Johnson
61.05%
2
1936
Franklin D. Roosevelt
60.80%
3
1972
Richard Nixon
60.67%
4
1920
Warren G. Harding
60.32%
5
1984
Ronald Reagan
58.77%
6
1928
Herbert Hoover
58.21%
7
1932
Franklin D. Roosevelt
57.41%
8
1956
Dwight D. Eisenhower
57.37%
9
1904
Theodore Roosevelt
56.42%
10
1952
Dwight D. Eisenhower
55.18%
11
1940
Franklin D. Roosevelt
54.74%
12
1924
Calvin Coolidge
54.04%
13
1944
Franklin D. Roosevelt
53.39%
14
1988
George H.W. Bush
53.37%
15
2008
Barack Obama
52.87%
16
1900
William McKinley
51.64%
17
1908
William H. Taft
51.57%
18
2012
Barack Obama
51.06%
19
1896
William McKinley
51.02%
20
1980
Ronald Reagan
50.75%
21
2004
George W. Bush
50.73%
22
1976
Jimmy Carter
50.08%
23
1960
John F. Kennedy
49.72%
24
1948
Harry S. Truman
49.55%
25
1916
Woodrow Wilson
49.24%
26
1996
Bill Clinton
49.23%
27
2000
George W. Bush
47.87%
28
1968
Richard Nixon
43.42%
29
1992
Bill Clinton
43.01%
30
1912
Woodrow Wilson
41.84%


There is a problem with this method of ranking, however.  In some elections, a third-party candidate took a large share of the vote, so the winner's percentage may look artificially small.  In 1992 and 1996, for instance, Bill Clinton won clearly even though H. Ross Perot kept his share below 50 percent.  So perhaps a better way of ranking is to look at the winning candidate's popular vote margin.  Just as in the preliminary count, President Obama's 2012 margin ranks 24th of 30.

1
1920
Warren G. Harding
26.17%
2
1924
Calvin Coolidge
25.22%
3
1936
Franklin D. Roosevelt
24.26%
4
1972
Richard Nixon
23.15%
5
1964
Lyndon B. Johnson
22.58%
6
1904
Theodore Roosevelt
18.83%
7
1984
Ronald Reagan
18.21%
8
1932
Franklin D. Roosevelt
17.76%
9
1928
Herbert Hoover
17.41%
10
1956
Dwight D. Eisenhower
15.40%
11
1912
Woodrow Wilson
14.44%
12
1952
Dwight D. Eisenhower
10.85%
13
1940
Franklin D. Roosevelt
9.96%
14
1980
Ronald Reagan
9.74%
15
1908
William H. Taft
8.53%
16
1996
Bill Clinton
8.51%
17
1988
George H.W. Bush
7.72%
18
1944
Franklin D. Roosevelt
7.50%
19
2008
Barack Obama
7.27%
20
1900
William McKinley
6.12%
21
1992
Bill Clinton
5.56%
22
1948
Harry S. Truman
4.48%
23
1896
William McKinley
4.31%
24
2012
Barack Obama
3.85%
25
1916
Woodrow Wilson
3.12%
26
2004
George W. Bush
2.46%
27
1976
Jimmy Carter
2.06%
28
1968
Richard Nixon
0.70%
29
1960
John F. Kennedy
0.17%
30
2000
George W. Bush
-0.51%

Thursday, December 6, 2012

"The First Real Digital Election"

The second edition of our book includes a boxed feature on the impact of social media and communications technology.  CNN reports on a forum to discuss this topic:
The 2012 contest, said Google’s Vice President for Public Policy Susan Molinari, was the “first real digital election” – a sentiment voiced by many digital and political experts gathered at CNN and Google’s “Exploring the 2012 Digital Election” event held Wednesday in Washington.
Online platforms acted as an “early warning system” for candidates, said Google’s Andrew Roos, pointing to spikes in search activity for phrases like “binders full of women” and “Big Bird” after they were uttered by GOP nominee Mitt Romney.
... Increasingly, the web is offering predictive tools that could become essential for campaigns looking to gauge their position ahead of important contests. Charles Scrase, Google’s head of elections, issue advocacy and non-profits, said search volume had become “so prominent we’re able to predict the outcome of primary elections,” including Rick Santorum’s surprise Iowa caucus win in January.
One shift from 2008, said multiple digital experts, was how voters viewed major events on the political calendar, including the two party conventions and the three presidential debates. Unlike in 2008, when those events were largely viewed only on televisions, voters this cycle were increasingly likely to watch on multiple screens.
...
Social media also changed how reporters covered the 2012 contest – which was marked by rapid pace news cycles and a steady flow of misinformation that was easily propagated online.
One area where Obama’s team held an advantage, said CNN’s Peter Hamby, was top members of the campaign’s willingness to participate in the online conversation. Senior Romney advisers were less visible
“Having the weight of David Axelrod come down on a story on Twitter could influence assignment editors, producers, reporters,” he said.
“They don’t just send you an email anymore,” added USA Today’s Jackie Kucinich.
In July Pew Internet reported:  "Television’s solitary screen is being supplemented by multi-screen interactivity. Half of all adult cell owners (52%) have used their phones recently for engagement, diversion, or interaction with other people while watching TV." [emphasis added]

CNN also reports on 5 takeways:
1.) It’s all about investing early: Both practitioners acknowledged that Obama’s campaign had a huge advantage, given that the digital team already had an infrastructure in place from the previous election. ...
2.) You have to persuade, not just organize: In 2008, [Obama's Andrew] said social media was a convenient platform to mobilize supporters. The “biggest change” this cycle, he said, was realizing that persuasion had to be “front and center” in social media, not just in advertising but in convincing the electorate who to vote for. ...
3.) Social media has become more efficient:  [Romney's Zac] and Bleeker agreed that social media platforms have made it possible for campaigns to be more persuasive. By building applications that allow for fundraising and more interaction between the campaigns and voters, social media has become more “meaningful,” Bleeker said.
4.) It’s about quality, not quantity: Part of what makes the interaction more meaningful is the ability to microtarget, the two rival digital strategists said. Moffatt said the Romney campaign was able to use geo-location on Facebook, where it could post relevant messages in respective areas. “We were doing 40 to 50 posts a day that most people didn’t see” because they were showing up in targeted areas, he said.
5.) Online has a longer life cycle than TV messaging: With television ads, a commercial may run for only a few days, but those same ads can live online indefinitely. After tallying up the number of times people played Romney ads online, people collectively spent 417 years watching their commercials online, Moffatt said. And according to Charles Scrase, Google’s head of elections, viewers are twice as likely to remember a message if they see it both online and on television.