American teenagers spend hours online each day, with apps such as YouTube and TikTok dominating their attention. Thirty-five percent spend at least four hours a day on social media or playing video games. The amount of time teens spend engaged in these activities varies across households. The survey finds that teen girls raised by parents without college degrees are on more social media apps, spend more hours using them, and are less inclined to cut back than girls whose parents went to college, while among boys, the same divide emerges in the hours spent gaming.
The class divide in social media use may exacerbate existing inequalities instead of reducing them. Among teen girls, more active social media engagement is associated with negative personal outcomes, including less sleep, lower rates of reading, and lower feelings of personal satisfaction.
The majority of teenagers are spending multiple hours on social media every day. About four in 10 (39 percent) spend three or more hours of their day online. YouTube and TikTok are the most popular social media platforms teens visit. More than seven in 10 (72 percent) spend time on YouTube every week, while six in 10 say the same of TikTok. Gaming also eats up a significant portion of teens’ free time, although less so than social media. More than four in 10 (44 percent) teens spend at least an hour gaming every day.
Teen girls raised in less educated households are more likely to use Instagram (66 percent vs. 57 percent), Snapchat (49 percent vs. 44 percent), Facebook (31 percent vs. 15 percent), and X (12 percent vs. 6 percent). The education gap is largest in TikTok use. Nearly three-quarters (73 percent) of teen girls raised by parents without college degrees spend time on the app, compared with only about half (53 percent) of teen girls whose parents have college degrees. There is also a significant difference in the number of apps they use.[v] Forty-one percent of teen girls with non-college-educated parents report using at least four different social media apps, compared with 25 percent of teen girls raised by college-educated parents.
This same gap is also evident in the amount of time teen girls spend on social media. About one in five (21 percent) say they spend between one and two hours on social media every day. Thirty-nine percent of teens report they spend less than an hour a day or do not use social media at all. Teen girls whose parents did not go to college, however, log more hours on social media than any of their peers. Nearly half (49 percent) of teen girls raised by parents without a college degree report spending three or more hours a day using social media, compared with 36 percent of teen girls with college-educated parents.
Parental education is also correlated with teens’ efforts to reduce their screen time. Among girls, those raised in households with parents of higher education levels are more likely to report attempting to reduce their time spent online. Nearly six in 10 (58 percent) teen girls raised by college-educated parents say they have tried to reduce their social media activity in the past 12 months. In contrast, only 40 percent of teen girls who have non-college-educated parents report attempts to lessen their social media activity.
There is no evidence of the same divide among teen boys; they report similar social media usage patterns regardless of parental education. More evident education divides show up in boys’ gaming habits. Teen boys raised by parents without college degrees spend substantially more time gaming. Nearly three in 10 (28 percent) teen boys raised by parents without college degrees say they spend an average of four or more hours a day playing video games. Among teen boys with college-educated parents, only 19 percent play video games this often. Among teen girls, it’s only 7 percent.
Showing posts with label gender equality. Show all posts
Showing posts with label gender equality. Show all posts
Wednesday, July 29, 2026
Inequality and Teen Social Media Use


Sunday, January 19, 2025
Biden and ERA
Peter Baker, Erica L. Green and Annie Karni at NYT:
President Biden declared on Friday that he believes that the Equal Rights Amendment has met the requirements of ratification and therefore is now part of the Constitution, but he declined to order the government to finalize the process by officially publishing it.
“In keeping with my oath and duty to Constitution and country, I affirm what I believe and what three-fourths of the states have ratified: The 28th Amendment is the law of the land, guaranteeing all Americans equal rights and protections under the law regardless of their sex,” Mr. Biden said in a statement.
Under the Constitution, however, the president has no direct role in approving amendments and his statement has no legal force by itself. The archivist of the United States, a Biden appointee, has refused to formally publish the amendment on the grounds that it has not met the requirements to become part of the Constitution.
Thomas Jipping, a senior legal fellow at the conservative Heritage Foundation, said that Mr. Biden’s announcement amounted to nothing more than his personal beliefs. He noted that Mr. Biden’s Justice Department had defended the archivist in a legal opinion, arguing that no “relevant legal authority” had been identified establishing that the amendment had been adopted past the congressional deadline.
There are 27 amendments to the Constitution and 1 amendment in the Apocrypha.
— Christopher J. Scalia (@cjscalia) January 17, 2025
Friday, February 16, 2024
Measuring Identity
Scott Keeter, Anna Brown, and Dana Popky at Pew:
Unlike most Pew Research Center reports, where the emphasis is on original research and the presentation of findings, our goal here is to explain how we do this – that is, how we measure some of the most important core characteristics of the public, which we then use to describe Americans and talk about their opinions and behaviors.
To do so, we first chose what we judged to be the most important personal characteristics and identities for comparing people who take part in our surveys. Then, for each trait, we looked at a range of aspects: why and how it came to be important to survey research; how its measurement has evolved over time; what challenges exist to the accurate measurement of each; and what controversies, if any, remain over its measurement.
These considerations and more shape how we at Pew Research Center measure several important personal characteristics and identities in our surveys of the U.S. public. Here are some things to know about key demographic questions we ask:
- Our main religion question asks respondents to choose from 11 groups that encompass 98% of the U.S. public: eight religious groups and three categories of people who don’t affiliate with a religion. Other, less common faiths are measured by respondents writing in their answer. Our questions have evolved in response to a rise in the share of Americans who do not identify with any religion and to the growing diversity in the country’s population. (Chapter 1)
- Measuring income is challenging because it is both sensitive and sometimes difficult for respondents to estimate. We ask for a person’s “total family income” the previous calendar year from all sources before taxes, in part because that may correspond roughly to what a family computed for filing income taxes. To reduce the burden, we present ranges (e.g., “$30,000 to less than $40,000”) rather than asking for a specific number. (Chapter 2)
- We ask about political party affiliation using a two-part question. People who initially identify as an independent or “something else” (instead of as a Republican or Democrat) and those who refuse to answer receive a follow-up question asking whether they lean more to the Republican Party or the Democratic Party. In many of their attitudes and behaviors, those who only lean to a party greatly resemble those who identify with it. (Chapter 3)
- Our gender question tries to use terminology that is easily understood. It asks, “Do you describe yourself as a man, a woman or in some other way?” Amid national conversation on the subjects, gender and sexual orientation are topics on the cutting edge of survey measurement. (Chapter 4)
- In part because we use U.S. Census Bureau estimates to statistically adjust our data, we ask about race and Hispanic ethnicity separately, just as the census does. People can select all races that apply to them. In the future, the census may combine race and ethnicity into one question. (Chapter 5)
- A person’s age tells us both where they fall in the life span, indicating what social roles and responsibilities they may have, and what era or generation they belong to, which may tell us what events in history had an effect on their political or social thinking. We typically ask people to report just the year of their birth, which is less intrusive than their exact date of birth. (Chapter 6)
Thursday, April 27, 2023
Little Gender Bias in Academic Science
Katherine Knott at Inside Higher Ed:
Claims of widespread gender bias in tenure-track hiring, grant funding and journal acceptances in the academic sciences are not supported by the data, a new study finds.
The paper published in Psychological Science in the Public Interest looked at two decades of research regarding biases that tenure-track women have faced since 2000. In the end, the authors determined tenure-track women in science, technology, engineering or math were at parity with men in tenure-track positions in the same fields when it comes to grant funding, journal acceptances and recommendation letters.
Women did have an advantage in the hiring process for the tenure-track jobs, though the evidence did show a bias against women in teaching evaluations and salaries. The salary gap, according to the report, was concerning but smaller than the oft-quoted statistic that women in STEM fields make 82 cents for every dollar that men earn. On average, the gap was 9 cents on the dollar.
“We’re getting really close to an equitable landscape,” said Wendy Williams, a professor in the department of human development at Cornell University and an author of the paper. “We’ve come 90 percent of the way, and so what stands between us and that is not an insurmountable task anymore. It’s really important for young women in college who are considering going to grad school and women in grad school who are considering becoming professors.”
Williams said the discourse about sexism in higher education can discourage some women from choosing a career in the academy.
Williams co-wrote the paper with Stephen Ceci, a professor of developmental psychology at Cornell, and Shulamit Kahn, an associate professor of economics at Boston University. The paper was “an adversarial collaboration,” bringing together researchers with different viewpoints. Williams and Ceci have written often to rebut frequent talking points on gender bias in STEM, while Kahn has a history of revealing gender inequities in her field.
Saturday, April 8, 2023
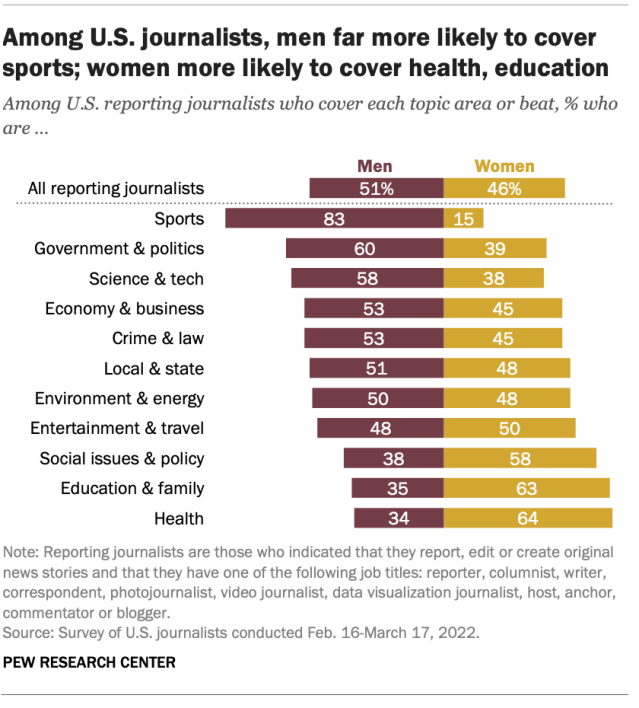
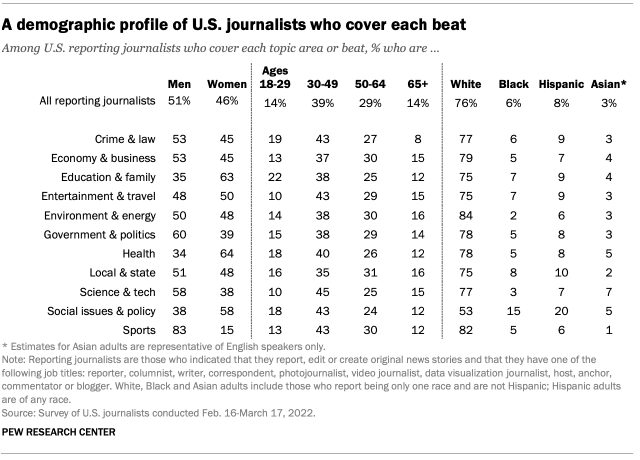
Beats and Journalist Demographics
Many posts have dealt with news media
Emily Tomasik and Jeffrey Gottfried at Pew:
Journalists’ beats also vary by their employment status – that is, whether they are freelance or self-employed journalists, or full- or part-time journalists at a news organization.
Monday, September 6, 2021
College Gender Gap
Douglas Belkin at WSJ:
At the close of the 2020-21 academic year, women made up 59.5% of college students, an all-time high, and men 40.5%, according to enrollment data from the National Student Clearinghouse, a nonprofit research group. U.S. colleges and universities had 1.5 million fewer students compared with five years ago, and men accounted for 71% of the decline.
This education gap, which holds at both two- and four-year colleges, has been slowly widening for 40 years. The divergence increases at graduation: After six years of college, 65% of women in the U.S. who started a four-year university in 2012 received diplomas by 2018 compared with 59% of men during the same period, according to the U.S. Department of Education.
...
The college gender gap cuts across race, geography and economic background. For the most part, white men—once the predominant group on American campuses—no longer hold a statistical edge in enrollment rates, said Mr. Mortenson, of the Pell Institute. Enrollment rates for poor and working-class white men are lower than those of young Black, Latino and Asian men from the same economic backgrounds, according to an analysis of census data by the Pell Institute for the Journal.
Saturday, December 28, 2019
ERA Deadline Issues
From the Congressional Research Service:
The proposed Equal Rights Amendment to the U.S. Constitution (ERA) declares that “equality of rights under the law shall not be denied or abridged by the United States or any State on account of sex….” The ERA was approved by Congress for ratification by the states in 1972; the amendment included a customary, but not constitutionally mandated, seven-year deadline for ratification. Between 1972 and 1977, 35 state legislatures, of the 38 required by the Constitution, voted to ratify the ERA. Despite a congressional extension of the deadline from 1979 to 1982, no additional states approved the amendment during the extended period, at which time the amendment was widely considered to have expired.
After 23 years in which no additional state voted to ratify the ERA, the situation changed when Nevada and Illinois approved the amendment, in March 2017 and May 2018, respectively. In addition, a change in party control of the Virginia legislature in the 2019 elections raised hopes among ERA supporters that this state might also vote to ratify, which would bring the number of approvals to 38, the requirement set by Article V for validation of a proposed amendment as part of the Constitution.
In the context of these developments, ERA proponents have renewed efforts to restart the ratification process. These actions center on the assertion that because the amendment did not include a ratification deadline within the amendment text, it remains potentially viable and eligible for ratification indefinitely. This proposal was originally known as the “Three State Solution,” for the number of state ratifications then necessary to reach the constitutional requirement that it be approved by three-fourths of the states. Supporters of this approach maintain that Congress has the authority both to repeal the original 1979 ratification deadline and its 1982 extension, and to restart the ratification clock at the current 37-state level—including the Nevada and Illinois ratifications—with or without a future ratification deadline. They assert that the broad authority over the amendment process provided to Congress by Article V of the Constitution includes this right. They further claim that the Supreme Court’s decision in Coleman v. Miller favors their position. They also note the precedent of the Twenty-Seventh “Madison” Amendment, which was ratified in 1992, 203 years after Congress proposed it to the states.
Opponents of reopening the amendment process may argue that attempting to revive the ERA would be politically divisive, and contrary to the spirit, and perhaps the letter, of Article V and Congress’s earlier intentions. They might also reject the example of the Twenty-Seventh Amendment, which, unlike the proposed ERA, never had a ratification time limit. Further, they might claim that efforts to revive the ERA ignore the possibility that state ratifications may have expired with the 1982 deadline, and that ERA proponents fail to consider the issue of state withdrawals from the amendment, known as rescissions, a question that has not been specifically decided in any U.S. court.
Monday, August 29, 2016
Unmarried America
From the Census:
The Buckeye Singles Council started “National Singles Week” in Ohio in the 1980s to celebrate single life and recognize singles and their contributions to society. The week is now widely observed during the third full week of September (Sept. 18-24 in 2016) as “Unmarried and Single Americans Week,” an acknowledgment that many unmarried Americans do not identify with the word “single” because they are parents, have partners or are widowed. In this edition of Facts for Features, unmarried people include those who were never married, widowed or divorced, unless otherwise noted.
Single Life
109 million The number of unmarried people in America 18 and older in 2015. This group made up 45 percent of all U.S. residents 18 and older.
Source:
America’s Families and Living Arrangements: 2015, Table A1

53% The percentage of unmarried U.S. residents 18 and older who were women in 2015; 47 percent were men.
Source:
63% The percentage of unmarried U.S. residents 18 and older in 2015 who had never been married. Another 24 percent were divorced and 13 percent were widowed.
Source:
19 million The number of unmarried U.S. residents 65 and older in 2015. These seniors made up 18 percent of all unmarried people 18 and older.
Source:
88
The number of unmarried men 18 and older for every 100 unmarried women in the United States in 2015.
Source:
59 million
The number of households maintained by unmarried men and women in 2015. These households comprised 47 percent of households nationwide.
Source:
35 million The number of people who lived alone in 2015. They comprised 28 percent of all households, up from 17 percent in 1970.
Source:
Parenting
36% The percentage of women age 15 to 50 with a birth in the last 12 months, as of 2014, who were widowed, divorced or never married.
Source:
2014 American Community Survey, Table B13002
39% The percentage of opposite-sex, unmarried-partner couples in 2015 that lived with at least one biological child of either partner.
Source:
788,730 The number of unmarried grandparents who were responsible for most of the basic care of a co-resident grandchild in 2014; 30 percent of coresident grandparents responsible for their grandchildren were unmarried.
Source:
Unmarried Couples
7 million The number of unmarried-partner households in 2014. Of this number, 448,271 were same-sex households.
Source:
Voters
39% The percentage of voters in the 2012 presidential election who were unmarried, compared with 24 percent of voters in the 1972 presidential election.
Source:
35% The percentage of voters in the 2014 November congressional election who were unmarried.
Source:
Education
87% The percentage of unmarried people 25 and older in 2015 who had completed high school or more education
Source:
27% The percentage of unmarried people 25 and older in 2015 with a bachelor’s degree or more education.
Source:
Thursday, July 1, 2010
International Perspectives: Gender Equality
A new international poll by Pew Global asked about views on gender equality. American views are similar to those of other industrial countries, but different from those of developing countries. One example:

Subscribe to:
Posts (Atom)