Search This Blog

Showing posts with label unemployment. Show all posts

Saturday, August 2, 2025

BLS Firing


Ben Casselman and Tony Romm at NYT:
President Trump unleashed his fury about weakness in the labor market on Friday, saying without evidence that the data were “rigged” and that he was firing the Senate-confirmed Department of Labor official responsible for pulling together the numbers each month.

In a long post on social media, Mr. Trump said he had directed his team to fire Erika McEntarfer, the commissioner of the Bureau of Labor Statistics, who was confirmed on a bipartisan basis in 2024.

Emily Liddel, an associate commissioner for the bureau, confirmed late Friday that Dr. McEntarfer had been fired and that William Wiatrowski, the deputy commissioner, would serve as acting commissioner.

The president fired Dr. McEntarfer after the bureau released monthly jobs data showing surprisingly weak hiring in July and large downward revisions to job growth in the previous two months. Economists widely interpreted the report as evidence that Mr. Trump’s policies were beginning to take a toll on the economy, though the president insisted in a subsequent post that the country was “doing GREAT!”

From Friends of the BLS:

Today, President Trump called into question the integrity of the Employment Situation report that the BLS released this morning. He accused BLS Commissioner Erika McEntarfer of deliberately reporting false numbers to reflect poorly on this administration. This baseless, damaging claim undermines the valuable work and dedication of BLS staff who produce the reports each month. This escalates the President’s unprecedented attacks on the independence and integrity of the federal statistical system.

The President seeks to blame someone for unwelcome economic news. The Commissioner does not determine what the numbers are but simply reports on what the data show. The process of obtaining the numbers is decentralized by design to avoid opportunities for interference. The BLS uses the same proven, transparent, reliable process to produce estimates every month. Every month, BLS revises the prior two months’ employment estimates to reflect slower-arriving, more-accurate information.

This rationale for firing Dr. McEntarfer is without merit and undermines the credibility of federal economic statistics that are a cornerstone of intelligent economic decision-making by businesses, families, and policymakers. U.S. official statistics are the gold standard globally. When leaders of other nations have politicized economic data, it has destroyed public trust in all official statistics and in government science.

BLS operates as a federal statistical agency and is afforded autonomy to ensure the data it releases are as accurate as possible. To politicize the work of the agency and its workers does a great disservice not only to BLS but to the entire federal statistical system which this country has relied on for almost 150 years. We stand firmly behind the BLS, Commissioner McEntarfer, and the data they work hard to produce. Commissioner McEntarfer is a widely-respected economist who has devoted her career to public service. She has an impeccable record. Over ninety percent of U.S. Senators supported her confirmation.

We call on Congress to respond immediately, to investigate the factors that led to Commissioner McEntarfer’s removal, to strongly urge the Commissioner’s continued service, and ensure that the nonpartisan integrity of the position is retained. The statement from the President undermines these tenets and politicizes data which cannot and should not be used for political points.

The Friends of BLS Co-Chairs: William Beach, Erica L. Groshen and Paul Schroeder

The Friends of BLS Steering Committee Members: Tom Beers, Demetra Nightingale, Mary Jo Mitchell, Steve Pierson, Ken Poole, Aaron Sojourne


Thursday, March 9, 2023

California Inequality

Income Inequality in California, by Tess Thorman, Daniel Payares-Montoya, and Joseph Herrera at PPIC

  • The gap between high- and low-income families in California is among the largest in the nation—exceeding all but three other states in 2021 (the latest data available). Families at the top of the income distribution earned 11 times more than families at the bottom ($291,000 vs. $26,000 for the 90th and 10th percentiles, respectively). In 1980, families at the top earned 7 times more than those at the bottom, and the current gap reflects 63% income growth for the 90th percentile, and 7% growth for the 10th percentile over four decades.
  • California’s income distribution reflects high rates of poverty. Income is frequently not enough to meet basic needs (on average a family of four requires about $37,000). Families in the bottom quarter of the income distribution are at risk of poverty absent major safety net programs.
  • Wealth is more unevenly distributed than income. In California, 20% of all net worth is concentrated in the 30 wealthiest zip codes, home to just 2% of Californians.
  • Californians are concerned. According to the PPIC Statewide Survey, 71% believe that the gap between rich and poor is increasing; a similar share think the government should do more to reduce that gap.
The COVID-19 pandemic widened income inequality.
  • Income inequality was shrinking in the years leading up to the pandemic, due to notable gains for the lowest-income families. Incomes for families at the 10th percentile increased by 23% between 2016 and 2019, compared to 5% for families at the 90th percentile.
  • Between 2019 and 2021, top incomes grew consistently, by 6% for the 90th percentile. Middle incomes (50th percentile) faltered in 2020 but rebounded in 2021. Low incomes (10th percentile) fell 7%.
  • These estimates describe pre-tax income and include a conservative estimate of unemployment (UI) benefits, without which low incomes would have been lower by at least 12% in 2020, and 5% in 2021. They also take a conservative approach with inflation, which may impact lower- and higher-income families differently and exacerbate inequality. For instance, from 2017–20, those in the bottom 20% spent 69% of all pre-tax income on food and transportation (including gasoline)—areas where prices have risen most—while those in the top 20% spent 14% of their income on those same categories.
Rising income inequality is driven by a job market that favors highly educated workers.
  • Shifts in technology and international trade have played key roles in reshaping jobs, creating advantages for college-degree holders. Among families in which any member holds a four-year degree or higher, median income has increased by 34% since 1980. Median income did not increase for families where no member holds a four-year degree.
  • Families with college graduates earn $2.24 for every $1 that families without college graduates earn, as of 2021.

Monday, September 5, 2022

Support for Unions

Gallup polls have been surveying Americans’ attitudes toward labor unions for nearly 90 years. Last week, the most recent Gallup survey found that union support was higher than it has been since the mid-1960s. Nearly three-quarters (71 percent) of respondents said they approved of labor unions.

Why?

Nearly three decades ago, a pair of researchers used statistical techniques to analyze decades of union approval polling. They wanted to find out why union support changed over time. Like previous research, they discovered that the state of the economy mattered. Specifically, Americans soured on unions when there was high unemployment — and were more supportive of unions when labor markets were tight.
The survey evidence suggests that this may still be true. Gallup surveys show a dramatic dip in union support between 2009 and 2012 — the last sustained period of high unemployment in the United States. Indeed, in 2009 support for organized labor fell below 50 percent for the first and only time in the Gallup series.
...

People are more likely to think unions are valuable when inequality seems high. Even in 2012, when overall support for organized labor was much lower than today, a strong majority agreed that “labor unions are necessary to protect the working person,” according to a Pew poll. People see unions as a counterweight to corporate power, fighting on behalf of average workers. Recent scholarship suggests local context matters: Rising economic inequality in one’s Zip code corresponds with greater support for labor unions. As the percentage of wealthy residents in one neighborhood climbs, so too does support for strengthening union

So why have unions gotten so much weaker?

Research points to the interrelated forces of automation, offshoring, and employer and political opposition as the key reasons the labor movement is weaker than it has been for a century. These underlying factors suggest rising popularity alone will not transform the fortunes of organized labor.

Sunday, July 25, 2021

Employment Challenges

Many posts have discussed inequality in employment and income.

Byron Auguste at WP:

While companies scramble to find talent amid perceived “skills gaps” and “labor shortages,” their job postings exclude millions of qualified Americans. These applicants do not face this dispiriting experience because of race, ethnicity, gender, age or disability — these reasons would be illegal, and rightly so. Instead, they are excluded because they’re among the roughly two-thirds of U.S. workers who lack a bachelor’s degree.
...

College-degree discrimination has become so widespread that many take it for granted. Almost three-quarters of new jobs from 2007 to 2016 were roles in which most employers typically “require” bachelor’s degrees — but fewer than 4 in 10 American workers have that credential. Going to war against arithmetic is a bad idea, and our post-pandemic skilled-worker shortage is a wake-up call.

Requiring a medical degree to treat patients or a civil engineering degree to design a bridge is common sense. By contrast, requiring a generic college degree to be considered for jobs such as office manager, sales representative, digital marketer or data-center technician may be common, but it makes no sense.

Noam Scheiber at NYT:

Building an electricity plant powered by fossil fuels usually requires hundreds of electricians, pipe fitters, millwrights and boilermakers who typically earn more than $100,000 a year in wages and benefits when they are unionized.

But on solar farms, workers are often nonunion construction laborers who earn an hourly wage in the upper teens with modest benefits — even as the projects are backed by some of the largest investment firms in the world. In the case of Assembly Solar, the backer is D.E. Shaw, with more than $50 billion in assets under management, whose renewable energy arm owns and will operate the plant.\

While Mr. Biden has proposed higher wage floors for such work, the Senate prospects for this approach are murky. And absent such protections — or even with them — there’s a nagging concern among worker advocates that the shift to green jobs may reinforce inequality rather than alleviate it.
...

While some of the new green construction jobs, such as building new power lines, may pay well, many will pay less than traditional energy industry construction jobs. The construction of a new fossil fuel plant in Michigan employs hundreds of skilled tradespeople who typically make at least $60 an hour in wages and benefits, said Mike Barnwell, the head of the carpenters union in the state.

By contrast, about two-thirds of the roughly 250 workers employed on a typical utility-scale solar project are lower-skilled, according to Anthony Prisco, the head of the renewable energy practice for the staffing firm Aerotek. Mr. Prisco said his company pays “around $20” per hour for these positions, depending on the market, and that they are generally nonunion.


Sunday, May 23, 2021

Bad Newspaper News

Mason Walker and Katerina Eva Matsa  at Pew:
Staff layoffs continued to pummel the beleaguered U.S. newspaper industry in 2020. A third of papers with an average Sunday circulation of 50,000 or more experienced layoffs last year, a period complicated by the impact of the coronavirus pandemic, according to a new Pew Research Center analysis which examined news articles that cited staff layoffs at these outlets.

These 2020 layoffs exceed the roughly one-quarter of papers in the same circulation range that experienced layoffs in 2019 (many were the same papers) as employment within the newspaper industry continued to fall precipitously in recent years.

Large-market newspapers – those with a Sunday circulation of 250,000 or more – were the most likely to suffer layoffs in 2020, with more than half of them experiencing staff cuts. That is unlike 2019, when cuts were roughly similar across the different tiers of circulation groups studied. Meanwhile, digital-native news outlets saw a slight uptick in layoffs in 2020 compared with 2019.

David Folkenflik at NPR:

The New York-based hedge fund Alden Global Capital – known for slashing its newspapers' budgets to extract escalated profits – won shareholder approval Friday for its $633 million bid to acquire the Tribune Publishing newspaper chain.

The purchase represents the culmination of Alden's years-long drive to take over the company and its storied titles – including the Chicago Tribune, The Baltimore Sun, New York Daily News and major metro papers from Hartford, Conn., to Fort Lauderdale, Fla.

Alden's reputation as a "vulture" fund had set off a frantic effort by union members in Tribune Publishing newsrooms. Their organizer, Baltimore Sun education reporter Liz Bowie, dubbed the effort "Project Mayhem." The journalists tried to secure potential buyers in numerous Tribune markets who embraced the public-minded aspirations of journalism, including the Maryland philanthropist and hotel magnate Stewart Bainum Jr.

After a process marked by intrigue and whiplash, Alden dashed all those hopes.


Saturday, February 13, 2021

Raising the Minimum Wage

 From the Congressional Budget Office:

If enacted at the end of March 2021, the Raise the Wage Act of 2021 (S. 53, as introduced on January 26, 2021) would raise the federal minimum wage, in annual increments, to $15 per hour by June 2025 and then adjust it to increase at the same rate as median hourly wages. In this report, the Congressional Budget Office estimates the bill’s effects on the federal budget. 
  • Higher prices for goods and services—stemming from the higher wages of workers paid at or near the minimum wage, such as those providing long-term health care—would contribute to increases in federal spending.
  • Changes in employment and in the distribution of income would increase spending for some programs (such as unemployment compensation), reduce spending for others (such as nutrition programs), and boost federal revenues (on net). 

...

Increasing the minimum wage would affect employment in several ways.
  • Higher wages would increase the cost to employers of producing goods and services. Employers would pass some of those increased costs on to consumers in the form of higher prices, and those higher prices, in turn, would lead consumers to purchase fewer goods and services. Employers would consequently produce fewer goods and services, and as a result, they would tend to reduce their employment of workers at all wage levels. 
  • When the cost of employing low-wage workers goes up, the relative cost of employing higher-wage workers or investing in machines and technology goes down. Some employers would therefore respond to a higher minimum wage by shifting toward those substitutes and reducing their employment of low-wage workers.
  • In some limited circumstances, increasing the minimum wage could boost employment if employers had what is known as monopsony power—that is, bargaining power that allows them to set wages below the rates that would prevail in a more competitive market.
  • Because increasing the minimum wage would shift income toward families with lower income, it would boost overall demand in the short term. Lower-income families spend a larger proportion of any additional income on goods and services than do families with higher income. That increased demand for goods and services would reduce the drop in employment for several years after the implementation of a higher minimum wage, CBO projects. 
Taking those factors into account, CBO projects that, on net, the Raise the Wage Act of 2021 would reduce employment by increasing amounts over the 2021–2025 period. In 2025, when the minimum wage reached $15 per hour, employment would be reduced by 1.4 million workers (or 0.9 percent), according to CBO’s average estimate. In 2021, most workers who would not have a job because of the higher minimum wage would still be looking for work and hence be categorized as unemployed; by 2025, however, half of the 1.4 million people who would be jobless because of the bill would have dropped out of the labor force, CBO estimates. Young, lesseducated people would account for a disproportionate share of those reductions in employment.

Monday, December 7, 2020

K-Shaped Recovery Is Here

Job growth in November was lower than expected.  Unemployment ticked down, but in part because of discouraged workers.  The K-shaped recovery is upon us.  James Hohmann at WP:

The leisure and hospitality sector has 3.4 million fewer jobs than in February. Only 31,000 jobs were added back in those industries last month, and there are mounting anecdotal reports of layoffs amid the worsening wave of covid-19.
The Transportation Department said Thursday that U.S. airlines employ 81,749 fewer Americans than in March, per Reuters. Southwest Airlines warned Thursday it could soon furlough another 6,800 employees, or about 12 percent of its workforce, per CNBC. 
A recovery tracker from Opportunity Insights shows that the employment rate for people making more than $60,000 a year is up compared to the start of the year, while low-wage jobs are down nearly 20 percent.

The Dow topped 30,000 for the first time ever last week. But lines of cars at food banks stretch for miles.

“Data from the scheduling software company Homebase shows the number of hours worked by employees, the number of employees clocking in and the number of open businesses falling beginning in late October, reaching its lowest levels since the spring,” Eli Rosenberg reports. “Mobility, measured in from cellphone data according to the Federal Reserve Bank of Dallas began falling nationally in mid-November. Consumer spending, measured by credit card and debit card data compiled by Opportunity Insights, began to fall at the end of October … The number of Americans reporting trouble getting enough to eat has been creeping up, according to Census Bureau data. About 13 percent of households with children reported being sometimes or often not having enough food to eat. More than one in three people surveyed recently said that they are having difficulty paying for household expenses.”

Tuesday, August 25, 2020

Long-Term Unemployment

Andrew Van Dam at  WP:
The devastating surge in unemployment in March and April was supposed to be temporary, as businesses shuttered to avert the greatest public health crisis in more than a century. Most workers reported they expected to be called back soon.

But nearly half a year later, many of the jobs that were stuck in purgatory are being lost forever. About 33 percent of the employees put on furlough in March were laid off for good by July, according to Gusto, a payroll and benefits firm whose clients include small businesses in all 50 states and D.C. Only 37 percent have been called back to their previous employer.

There were 3.7 million U.S. unemployed who had permanently lost their previous job as of July, according to the Labor Department. That figure doubled from February to June, held steady in July, and is expected to hit between 6.2 million and 8.7 million by late this year, according to a new analysis from economists Gabriel Chodorow-Reich of Harvard University and John Coglianese of the Federal Reserve Board.

Sunday, August 23, 2020

COVID Inequality: the K-Shaped Recovery

Heather long at WP:
U.S. stocks are hovering near a record high, a stunning comeback since March that underscores the new phase the economy has entered: The wealthy have mostly recovered. The bottom half remain far from it.

This dichotomy is evident in many facets of the economy, especially in employment. Jobs are fully back for the highest wage earners, but fewer than half the jobs lost this spring have returned for those making less than $20 an hour, according to a new labor data analysis by John Friedman, an economics professor at Brown University and co-director of Opportunity Insights.

Though recessions almost always hit lower-wage workers the hardest, the pandemic is causing especially large gaps between rich and poor, and between White and minority households. It is also widening the gap between big and small businesses. Some of the largest companies, such as Nike and Best Buy, are enjoying their highest stock prices ever while many smaller businesses fight for survival.
Some economists have started to call this a “K-shaped” recovery because of the diverging prospects for the rich and poor, and they say policy failures in Washington are exacerbating the problems.
...
As much of the economy has moved to work-from-home mode, the shift has mainly benefited college-educated employees who do most of their work on computers. A Fed survey found that 63 percent of workers with college degrees could perform their jobs entirely from home, while only 20 percent of workers with high school diplomas or less could work from home.

Richer Americans also have seen their wealth recover — or even surge — as home values have jumped to their highest level ever (even in inflation-adjusted terms), according to the National Association of Realtors.

Thursday, May 21, 2020

Media Slashes

Newspapers and magazines were on the decline even before COVID-19 Now things are much worse as advertising has dried up.

Sara Fischer at Axios:
The Atlantic is laying off nearly 20% of staff, according to an internal note from David Bradley, the publication's chairman, that was obtained by Axios.
Why it matters: It's the latest media company that's been been forced to take drastic measures to survive the economic fallout from the coronavirus pandemic.
The state of play: The 68 staff cuts are mostly attributable to the collapse of the company's events business, which was one of its strongest pillars for many years.
..
The big picture: The pandemic is forcing dozens of major media companies, including newer, digitally-native media companies and older magazine companies, to carry out layoffs and pay cuts.
The Atlantic joins The Hollywood Reporter, Fortune, Billboard, The Economist Group, Group Nine Media, BuzzFeed News, Vox Media, Bustle Digital Group, Cheddar, Maven Media, G/O Media, Protocol and others who have resorted to layoffs and furloughs.
Sara Fischer and Scott Rosenberg at Axios:
Over 500 people in the U.S. news media were laid off last week, indicating that many companies' initial efforts at the start of the pandemic to avoid job cuts, like reducing executive pay, weren't sufficient to protect their work forces.
...
By the numbers: Layoffs at Vice (155 people), Quartz (80 people), The Economist (90 people), Condé Nast (100 people) and furloughs at Buzzfeed (68) and Condé Nast (another 100) were posted last week. Hundreds more are expected in coming months.
...
The big picture: Thousands of other jobs in the news media industry have been lost at the local and global levels. Student internships and fellowships have mostly been cancelled, hindering younger journalists from experience and exposure within the industry.

Friday, May 8, 2020

Unemployment and the Depression

Total nonfarm payroll employment fell by 20.5 million in April, and the unemployment rate rose to 14.7 percent, the U.S. Bureau of Labor Statistics reported today. The changes in these measures reflect the effects of the coronavirus (COVID-19) pandemic and efforts to contain it. Employment fell sharply in all major industry sectors, with particularly heavy job losses in leisure and hospitality.
This news release presents statistics from two monthly surveys. The household survey measures labor force status, including unemployment, by demographic characteristics. The establishment survey measures nonfarm employment, hours, and earnings by industry. ...
Household Survey Data In April, the unemployment rate increased by 10.3 percentage points to 14.7 percent. This is the highest rate and the largest over-the-month increase in the history of the series (seasonally adjusted data are available back to January 1948). The number of unemployed persons rose by 15.9 million to 23.1 million in April. The sharp increases in these measures reflect the effects of the coronavirus pandemic and efforts to contain it. ...
The labor force participation rate decreased by 2.5 percentage points over the month to 60.2 percent, the lowest rate since January 1973 (when it was 60.0 percent). Total employment, as measured by the household survey, fell by 22.4 million to 133.4 million. The employment-population ratio, at 51.3 percent, dropped by 8.7 percentage points over the month. This is the lowest rate and largest over-the-month decline in the history of the series (seasonally adjusted data are available back to January 1948). (See table A-1.)
...
Establishment Survey Data Total nonfarm payroll employment fell by 20.5 million in April, after declining by 870,000 in March. The April over-the-month decline is the largest in the history of the series and brought employment to its lowest level since February 2011 (the series dates back to 1939). Job losses in April were widespread, with the largest employment decline occurring in leisure and hospitality. (See table B-1. For more information about how the establishment survey and its measures were affected by the coronavirus, see the box note at the end of the news release.)


19293.2
19308.7
193115.9
193223.6
193324.9
193421.7
193520.1
193616.9
193714.3
193819.0
193917.2

Saturday, April 25, 2020

Dark Economic Clouds

An April 24 report from CBO:
CBO has developed preliminary projections of key economic variables through the end of calendar year 2021, based on information about the economy that was available through yesterday and including the effects of an economic boost from legislation recently enacted in response to the pandemic. In addition, CBO has developed a preliminary assessment of federal budget deficits and debt for fiscal years 2020 and 2021. CBO will provide a comprehensive analysis of that legislation and updated baseline budget projections later this year.
In the second quarter of 2020, the economy will experience a sharp contraction, and CBO’s current economic projections include the following:
  • Inflation-adjusted gross domestic product (real GDP) is expected to decline by about 12 percent during the second quarter, equivalent to a decline at an annual rate of 40 percent for that quarter.
  • The unemployment rate is expected to average close to 14 percent during the second quarter.
  • Interest rates on 3-month Treasury bills and 10-year Treasury notes are expected to average 0.1 percent and 0.6 percent, respectively, during that quarter.
  • For fiscal year 2020, CBO's early look at the fiscal outlook shows the following:
  • The federal budget deficit is projected to be $3.7 trillion.
  • Federal debt held by the public is projected to be 101 percent of GDP by the end of the fiscal year.
An April 22 report from the Committee for a Responsible Federal Budget:
Today, the Social Security Trustees released their annual report, showing that Social Security faces a precarious and worsening financial situation – even before accounting for the current public health crisis. The novel coronavirus (COVID-19) pandemic is likely to further worsen the program’s finances, mainly by depressing payroll tax revenue.
...
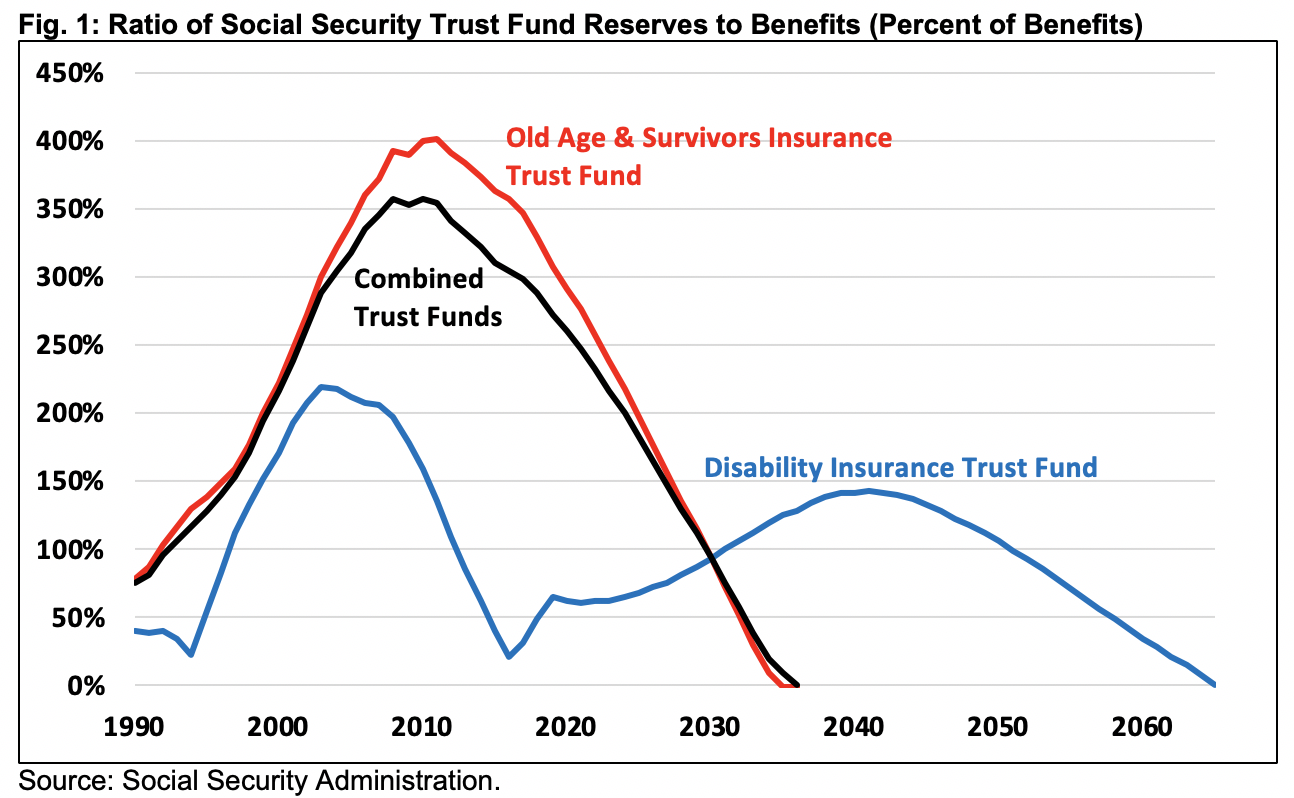
Before incorporating the adverse effects of the COVID-19 crisis, the Social Security Trustees project the program is only 15 years from insolvency.

They project the Old-Age & Survivors Insurance (OASI) trust fund will deplete its reserves by 2034, while the Social Security Disability Insurance (SSDI) trust fund is projected to be exhausted by 2065. On a theoretical combined basis – assuming revenue is reallocated between the funds in the years between OASI and SSDI insolvency – Social Security will become insolvent by 2035.

Upon insolvency, all beneficiaries regardless of age, income, or need will face a 21 percent across-the-board benefit cut, which will grow to 27 percent by the end of the projection window.
The year 2035 is only 15 years away. That means the trust funds will run out of reserves when today’s 52-year-olds reach the normal retirement age and today’s youngest retirees turn 77. For perspective, the average new retiree will live to age 85, meaning Social Security cannot guarantee full benefits for many current retirees, let alone future beneficiaries (See How Old You Will Be When Social Security’s Funds Run Out).

In reality, the situation is far worse. The current economic crisis will dramatically reduce payroll tax revenue this year and beyond; it is also likely to increase disability applications. As a result, Social Security Disability Insurance is likely to be insolvent decades earlier than the Trustees project – perhaps in the 2020s – and the old age program several years earlier than projected.

Wednesday, September 4, 2019

Employment of Military Spouses

Russ Read at The Washington Examiner:
Between 35% and 50% of military spouses work in fields that require occupational licenses or certifications, which are not always recognized when couples move to a new state or country. With the constant moves military life requires, the difficulty drastically increases. Lawyers and teachers are some of the hardest hit, but thanks to the work of advocacy groups across the country, they are seeing some relief from federal and state governments.
...
Military spouses are unemployed at four times the rate of civilians, and those seeking employment are unemployed for about four months every time they move. The average military member will move every two to three years, and that lost time and salary can add up significantly over the typical 20-year military career. Even when spouses find jobs, they earn $12,000 less than their civilian colleagues, losing nearly $190,000 over their careers.
Spouses and advocate groups say financial considerations play a major role in whether a service member will continue to serve the country.

Friday, February 22, 2019

Spatial Mismatch of Jobs

A new report from the Urban Institute analyzed 2017 application data across several types of low-wage, hourly jobs in 16 major U.S. cities, looking at the mismatch between openings and job seekers by zip code.
  • In 41% of Boston-area zip codes, there were far more openings than job-seekers who lived a reasonable distance away. In other words, most possible applicants lived too far from the workplace — there either was no efficient public transportation to the job, or it cost too much to get there.
  • In New York, 32% of zip codes had this problem. In San Francisco, 29%.
 ...
The backdrop: Half a century ago, there was a hollowing out of big cities. As high-earning workers moved to suburbs, low-income residents were left behind.
Today, as cities have had a resurgence, there are tons of jobs in downtowns, but gentrification and a surge in housing costs are once again keeping low-income workers away from jobs, says Yingling Fan, a professor at the University of Minnesota.
What's happening: Poorer city residents live in the "last-subway-stop" parts of cities, a couple of hours, or further, from work — and they can't afford to move.
Often, the long commute is not worth the trouble. "You could take a couple buses to that restaurant job if there’s a career ladder there or if the wages and benefits are worth it," says Christina Stacy, lead author of the Urban Institute report. But that's rarely the case.

Friday, January 25, 2019

Media Layoffs

Many posts have discussed the economic troubles of the media industry.

Sara Fischer at Axios:
  • Verizon Media will cut roughly 800 jobs, or 7% of its global workforce across the organization, as well as certain brands and products. Verizon CEO Hans Vestberg told Axios earlier this month that each of the company's three units, including the media business, needed to be able to stand on their own. (A company spokesperson later clarified to Axios that Verizon Media Group will still have access to Verizon customer data when customers opt in to provide such information.)
  • Buzzfeed will cut roughly 250 jobs, or roughly 15% of its workforce, including jobs within its news division.
  • Gannett cut over 20 jobs Wednesday, per Poynter, with more expected as the company tries to shed costs amid buyout talks.

Friday, May 4, 2018

Stagnant Wages

Despite low unemployment, wage growth has stagnated. Mark Whitehouse at Bloomberg:
When I checked a couple months ago, I found pretty much zero evidence that companies were increasing wages any more than they otherwise would have. Now that we have data from two more jobs reports, let’s take another look.Overall, wage gains do not appear to have accelerated. From December through April, average hourly earnings increased at an annualized pace of 2.3 percent, significantly slower than in 2017. .. 
Also, industries getting bigger tax breaks aren’t giving bigger raises. Two months ago, there was no correlation between the size of tax cuts and wage gains across sectors. Now it’s strongly negative. Companies engaged in wholesale trade reduced wages, even though they’re supposed to save 40 percent during the next decade (according to the Penn Wharton Budget Model). Utilities, among the biggest losers in the tax reform, raised wages at a 6.4 percent annualized rate.

Sunday, December 3, 2017

Labor Force Participation

In December 2007, two-thirds (66.0%) of civilians ages 16 and over either were employed or actively looking for work; as of October of this year, only 62.7% were. The labor force participation rate, as it’s called, fell steadily throughout the Great Recession and well into the subsequent recovery. It bottomed out at a seasonally adjusted 62.4% in September 2015 and has risen only slightly since then.

Labor economists generally agree that waves of retiring Baby Boomers explain much, though not all, of the decline. Other possible contributing factors include people spending more years in school, and hence fewer on the job; a decline in demand for less-skilled labor; and what one researcher has called a “flight from work,” especially among men. (An estimated 524,000 jobless Americans last month reported not actively looking for work because they’re discouraged about their employment prospects – more than the 363,000 who reported being discouraged in December 2007, but less than the 1.3 million peak in December 2010.)

Friday, November 24, 2017

Automation Gains Momentum

Evan Halper at LAT:
Driverless vehicles threaten to dramatically reduce America’s 1.7-million trucking jobs. It is the front end of a wave of automation that technologists and economists have been warning for years will come crashing down on America’s political order. Some predict it could rival the impact of the economic globalization and the resulting off-shoring of jobs that propelled Trump’s victory in the presidential election.
“This is one of the biggest policy changes of our generation,” said Sam Loesche, head of government affairs for the Teamsters. “This is not just about looking after the health and welfare of America’s workers, but also their livelihoods.”
Washington isn’t ready for it. The Trump White House already has indicated it sees it as some future administration’s problem. Silicon Valley remains in shock over Treasury Secretary Steven T. Mnuchin’s remark in the spring that economic fallout from this type of automation is 50 to 100 years off and “not even on my radar screen.”
“I don’t think anybody there is thinking about this seriously,” said Martin Ford, author of “Rise of the Robots: Technology and the Threat of a Jobless Future.” “They are still looking at this as futuristic and not having an impact and not politically toxic. … Once people start seeing the vehicles on the roads and jobs disappearing because of them, things will quickly become very different.”

The arrival of that reckoning is getting accelerated by Washington’s bipartisan excitement for self-driving technology, one of the few policy issues advancing. New Trump administration regulations don’t require industry to submit certain safety assessments, leaving it voluntary. And legislation — already approved in the House and expected to pass in the Senate — strips authority from states to set many of their own safety guidelines.
At Reuters, Lisa Baertlein and P.J. Huffstutter explain that immigration crackdowns are creating more jobs ... for robots
 Convincing big U.S. dairy owners to buy robots to milk their cows - and reduce the farmhands they employ - used to be a tough sell for Steve Fried. Recently, his job has gotten easier, he says, in part because of President Donald Trump.
...
 Trump’s crackdown on illegal immigration through stepped-up arrests and border enforcement has shaken the U.S. agricultural sector, where as many as 7 in 10 farm workers are undocumented, according to the American Farm Bureau Federation.
...
A 2014 report by WinterGreen Research forecast significant growth in the use of robotics in “every aspect of farming, milking, food production” and other agricultural enterprises. The report put the market for agricultural robots at $817 million in 2013 and projected that it would reach $16.3 billion by 2020.

Thursday, May 4, 2017

Stores Are Closing

Suzanne Kapner reports at The Wall Street Journal:
Through April 6, closings have been announced for 2,880 retail locations this year, including hundreds of locations being shut by national chains such as Payless ShoeSource Inc. and RadioShack Corp. That is more than twice as many closings as announced during the same period last year, according to Credit Suisse.
Based on the pace so far, the brokerage estimates retailers will close more than 8,600 locations this year, which would eclipse the number of closings during the 2008 recession.
At least 10 retailers, including apparel seller Limited Stores Co., electronics chain Hhgregg Inc. and sporting-goods chain Gander Mountain Co., have filed for bankruptcy protection so far this year. That compares with nine retailers that declared bankruptcy, with at least $50 million liabilities, for all of 2016.
The seeds of the industry’s current turmoil date back nearly three decades, when retailers, in the throes of a consumer-buying spree and flush with easy money, rushed to open new stores. The land grab wasn’t unlike the housing boom that was also under way at that time.
“Thousands of new doors opened and rents soared,” Richard Hayne, chief executive ofUrban Outfitters Inc., told analysts last month. “This created a bubble, and like housing, that bubble has now burst.”
...
As retailers rushed to expand their physical footprint, the internet was gearing up to do to apparel companies what it had already done to booksellers: sap profits and eliminate what little pricing power these chains commanded.

Tuesday, May 2, 2017

Young Adults

From the Census Bureau:
Today’s young adults look different from prior generations in almost every regard: how much education they have, their work experiences, when they start a family and even who they live with while growing up. A new U.S. Census Bureau report, The Changing Economics and Demographics of Young Adulthood: 1975–2016, looks at changes in young adulthood over the last 40 years. The report focuses on the education, economics and living arrangements of today's young adults and how their experiences differ in timing and degree from what young adults experienced in the 1970s.
Highlights 
  • Most of today’s Americans believe that educational and economic accomplishments are extremely important milestones of adulthood. In contrast, marriage and parenthood rank low: over half of Americans believe that marrying and having children are not very important in order to become an adult.
  • Young people are delaying marriage, but most still eventually tie the knot. In the 1970s, 8 in 10 people married by the time they turned 30. Today, not until the age of 45 have 8 in 10 people married.
  • More young people today live in their parents’ home than in any other arrangement: 1 in 3 young people, or about 24 million 18- to 34-year olds, lived in their parents’ home in 2015.
  • In 2005, the majority of young adults lived independently in their own household, which was the predominant living arrangement in 35 states. A decade later, by 2015, the number of states where the majority of young people lived independently fell to just six. Of the top five states where the most young adults lived independently in 2015, all were in Midwest and Plains states.
  • More young men are falling to the bottom of the income ladder. In 1975, 25 percent of young men ages 25 to 34 had incomes of less than $30,000 per year. By 2016, that share rose to 41 percent of young men (incomes for both years are in 2015 dollars).
  • Between 1975 and 2016, the share of young women who were homemakers fell from 43 percent to 14 percent of all women ages 25 to 34.
  • Of young people living in their parents’ home, 1 in 4 are idle, that is they neither go to school nor work. This figure represents about 2.2 million 25- to 34-year-olds. Among other characteristics, these young adults are more likely to have a child, so they may be caring for family, and over one quarter have a disability of some kind.