Search This Blog

Showing posts sorted by relevance for query women congress. Sort by date Show all posts

Sunday, January 15, 2023

Women in Congress 2023

 Rebecca Leppert and Drew DeSilver at Pew:

Women make up more than a quarter (28%) of all members of the 118th Congress – the highest percentage in U.S. history and a considerable increase from where things stood even a decade ago.

Counting both the House of Representatives and the Senate, women account for 153 of 540 voting and nonvoting members of Congress. That represents a 59% increase from the 96 women who were serving in the 112th Congress a decade ago, though it remains far below women’s share of the overall U.S. population. A record 128 women are serving in the newly elected House, accounting for 29% of the chamber’s total. In the Senate, women hold 25 of 100 seats, tying the record number they held in the 116th Congress.

The 2022 midterm elections sent nearly two dozen new congresswomen to the House, including Becca Balint, a Vermont Democrat who became both the first woman and openly LGBTQ person elected to Congress from the state. Of the 22 freshman representatives who are women, 15 are Democrats and seven are Republicans.

The Senate gained just one new female member: Republican Katie Britt, who became the first woman senator from Alabama.

Many female incumbents who sought reelection this midterm cycle – 105 representatives and all five senators – kept their seats. Rep. Marcy Kaptur, D-Ohio, who first joined the House in 1983, retained her title as the longest-serving congresswoman in the chamber. California Rep. Nancy Pelosi, who’s served in Congress for 35 years and became the first female speaker of the House in 2007, also won reelection. But she announced she wouldn’t run for another leadership role after Republicans flipped control of the House.

Women make up a much larger share of congressional Democrats (41%) than Republicans (16%). Across both chambers, there are 109 Democratic women and 44 Republican women in the new Congress. Women account for 43% of House Democrats and 31% of Senate Democrats, compared with 16% of House Republicans and 18% of Senate Republicans. Still, the number of GOP women in the House is at its highest total yet: 35, up from 30 in January 2021, when the 117th Congress began.


Sunday, October 1, 2023

Women in Congress

A number of posts have discussed the growing number of women in office.

 Katherine Schaeffer at Pew:


Women in the U.S. Senate, 1965-2023
% of U.S. senators who are women
0%10%20%30%40%50%197019801990200020102020Starting dateofcongressionalterm
Note: Percentages are the share of women senators at the outset of each term of Congress.
Source: Pew Research Center analysis of Congressional Biographical Directory data.
PEW RESEARCH CENTER

At the start of the 118th Congress in 2023, there were 25 women serving in the U.S. Senate, just shy of the record 26 women senators sworn in on the first day of the previous Congress. (The count for the previous Congress includes Vice President Kamala Harris and former Georgia Sen. Kelly Loeffler. Both were sworn in on the first day and left the Senate shortly after.)

Of the 25 women senators:
  • 16 are Democrats and nine are Republicans.
  • 22 are White, two are Asian American and one is Hispanic. No Black women currently serve in the Senate, nor do any American Indian or Alaska Native women.
The first-ever woman in the Senate was Rebecca Latimer Felton, D-Ga., who was appointed to the seat as a political maneuver in 1922 and served just one day. Nancy Kassebaum, R-Kan., who served in the Senate from 1978 to 1997, was the first woman senator who was elected for a full term without having a spousal connection to Congress.

U.S. House


Women in the U.S. House, 1965-2023
% of U.S. representatives who are women
0%10%20%30%40%50%197019801990200020102020Starting dateofcongressionalterm
Note: Percentages are the share of women representatives at the outset of each term of Congress.
Source: Pew Research Center analysis of Congressional Biographical Directory data.
PEW RESEARCH CENTER


On the first day of the 118th Congress, 124 women were voting members in the House of Representatives, making up 28% of the chamber’s voting membership. In addition, four women serve as nonvoting delegates to Congress, representing American Samoa, the District of Columbia, Puerto Rico and the U.S. Virgin Islands.

Of the women voting representatives sworn in on the first day of the session:
  • 91 are Democrats and 33 are Republicans.
  • 26 are Black, 18 are Hispanic, seven are Asian American, two are Native American and one is multiracial.

Jeannette Rankin, R-Mont., was the first woman to be elected to Congress, taking office in 1917. Nancy Pelosi, D-Calif., is the only woman to have served as speaker of the House. She was speaker from 2007 to 2011, served as the minority leader in the Republican-controlled House from 2011 to 2019 and was elected speaker again from 2019 to 2023.

Sunday, January 17, 2021

Women in Congress

Many posts have discussed women in politics.

Carrie Elizabeth Blazina and Drew DeSilver at Pew:
Counting both the House of Representatives and the Senate, 144 of 539 seats – or 27% – are held by women. That represents a 50% increase from the 96 women who were serving in the 112th Congress a decade ago, though it remains far below the female share of the overall U.S. population. A record 120 women are serving in the newly elected House, accounting for 27% of the total. In the Senate, women hold 24 of 100 seats, one fewer than the record number of seats they held in the last Congress.

This analysis counts voting as well as nonvoting members of Congress. Figures for the 117th Congress exclude two House seats that were vacant as of early January. It also excludes Sens. Kamala Harris, who is expected to resign her seat ahead of her inauguration as vice president on Jan. 20, and Kelly Loeffler, who lost a runoff election in Georgia earlier this month. Both are set to be replaced by men.
How we did this

Women make up a much bigger share of congressional Democrats (38%) than Republicans (14%). Across both chambers, there are 106 Democratic women and 38 Republican women in the new Congress. Women account for 40% of House Democrats and 32% of Senate Democrats, compared with 14% of House Republicans and 16% of Senate Republicans.

The 2020 general election sent just one new congresswoman to the Senate, Republican Cynthia Lummis of Wyoming, making her the first female senator to represent that state.

Republican women made significant gains in the House in the most recent election cycle. Of the 27 newly elected representatives who are women, two-thirds (18) are Republicans. Between the 115th and 116th Congresses, the number of GOP women in the House fell from 25 to 15. That number doubled this year to 30, the highest total ever.

California Rep. Nancy Pelosi, a Democrat and the first female speaker of the House, is serving her fourth term as speaker after being reelected earlier this month.

The partisan gender division hasn’t always looked this way. Until the 1929 stock market crash, most of the dozen women elected to the House were Republicans, and for several decades afterward the two parties were generally close in numbers in that chamber. But the gap widened in the 1970s and has persisted, despite a temporary narrowing during the Reagan-Bush 1980s. Of the 232 women elected to the House in 1992 or later, 157 (68%) have been Democrats, as have 27 of the 42 women (64%) who have served in the Senate since 1992.

Thursday, February 21, 2019

Women in Congress

Abigail Geiger, Kristen Bialik and John Gramlich at Pew:
The number of women in Congress is at an all-time high. About a century after Montana Republican Jeannette Rankin became the first woman elected to Congress, there are 127 women in the legislature, accounting for a record 24% of voting lawmakers across both chambers. (In addition, four of the six nonvoting House members, who represent the District of Columbia and U.S. territories, are women.)
There are more women in the Senate than ever (25), and in six states – Arizona, California, Minnesota, Nevada, New Hampshire and Washington – both senators are women, up from three states in the previous Senate.
These gains have been relatively recent, however. The House has seen slow but steady growth in the number of female members since the 1920s. Growth in the Senate has been slower: The Senate did not have more than three women serving at any point until the 102nd Congress, which began in 1991. And the share of women in Congress remains far below the share of women in the country as a whole (24% vs. 51%).


Saturday, January 2, 2021

Women Candidates in 2020

 Stacy Montemayor and Pete Quist, National Institute on Money in Politics; Karl Evers-Hillstrom and Grace Haley, Center for Responsive Politics, | 2020-12-21

Key findings:

  • Between 2016 and 2020, the percentage of women candidates in gubernatorial and state legislative races saw a massive jump, from 25 percent to 32 percent.
  • At least 142 women will hold seats in the next Congress, an all-time high mark.
  • In 2020 races for the U.S. House and Senate, women candidates outraised men on average, while also nearly closing the gap in state-level contests.
  • In 2020 races, women accounted for 33 percent of donations to congressional candidates and 31 percent of donations to state-level candidates, both record marks.
...

Republican women also made gains in state races, though they were less pronounced. Women made up nearly 23 percent of 2020 Republican candidates, up from 18 percent in 2016. The biggest jump came from non-incumbent Republicans. In 2016, nearly 19 percent of Republican challengers were women. That figure jumped to 27 percent in this year’s elections.

Figure 2: Women candidates in 2020 state races, by party

Women candidates generally won at the same rate at which they ran at the state level. In 2020, 32 percent of all candidates for state legislative and gubernatorial seats were women, and 32 percent of the general election winners were women. In the 2016 and 2012 election cycles, women only accounted for 26 percent of general election winners.

Gender parity at the state level is still a ways off despite modest gains. Nevada remains the only state in the nation with a majority-female legislature. The vast majority of leadership positions in state legislatures are held by men. Just seven women serve as speakers of state houses, and nine women currently serve as governors.

Sunday, September 20, 2020

Brain Drain on the Hill


Executive Summary

This research report comprehensively investigates congressional capacity and governance using publicly available data on long-term trends in legislative branch expenditures and data Furnas and LaPira collected in the 2017 and 2019 Congressional Capacity Surveys (CCS).1 When combined, the CCS is the most comprehensive time-series cross-sectional survey of congressional staffers’ professional backgrounds, career paths, policy views, technical knowledge, substantive expertise, and job experiences ever conducted. We document how the decline in legislative capacity has changed during the era of rising polarization and increasing political party competition. As a consequence, legislative staff in Washington are asked to do more and more, with less and less.
  1. Congress is a funnel to lucrative jobs in lobbying. Between 40−45 percent see the private sector as their next career step. Roughly half of staff aiming to enter the private sector after serving on the Hill want to become lobbyists. For the most part, working on the Hill is viewed as an entry-level position for K Street, rather than a stepping stone for a career in public service.
  2. Staff resources have shifted to the district. The share of total staffer full-time equivalents dedicated to Washington, D.C. offices has fallen from more than 70 percent in the 1970s to 50 percent in recent years.
  3. There are fewer resources to pay staff. In the House of Representatives, the budget allocated for office staff hires fell by 10 percent from 2013 to 2017.
  4. Staff pay is declining. Salaries fell among communications, legislative, and administrative staff following the 110th Congress (2007-2008). The decline cannot alone be attributed to the member pay freeze and austerity measures resulting from the Great Recession because the decline in resources allocated for legislative staff started well before 2007.
  5. Congressional staffers in important roles are largely inexperienced. Most staff who manage policy portfolios in Congress have only one or two years of Hill experience. That is, roughly one-third of legislative staffers have not yet served the duration of a single Congress. Conversely, staffers in both chambers who have spent more time working in Congress are measurably more knowledgeable about institutional procedures and important policy topics.
  6. Capitol Hill is staffed primarily by Millennials. Roughly 60 percent of the congressional staffer population is under the age of 35, and 75 percent under 40 years old.
  7. Turnover among congressional staff is exceedingly high. The average tenure for staff on Capitol Hill is 3.1 years. About 65 percent of staffers plan to leave Congress within five years. Even more strikingly, 43 percent plan to depart by the end of the Congress in which they are employed.
  8. Most do not see working in Congress as a long-term career option. Even among those who would like to continue careers in the public sector, more than half (55 percent) plan to leave Congress.
  9. Staffers work extremely long hours, and are spread thin. More than 65 percent of staff work 50+ hours a week, and 20 percent of staff work 60+ hours. Of senior staffers, 65 percent work 60+ hours a week. The average legislative staffer works on two to six issue areas every single day.
  10. Staff like working for their boss, but not so much for Congress. Seventy-six percent report a very strong or strong sense of belonging in their employing office, but only 61 percent feel similarly about Congress as a whole. This institutional deficit is greater for women and staffers who are Black, Indigenous, and people of color (BIPOC).
  11. In Congress, experience yields knowledge, but is not rewarded. Staffers that have spent more time working in Congress are measurably more knowledgeable about institutional procedures and important policy topics. This is true across both chambers, and is unrelated to actual work assignments. Yet, turnover is so high and retention rates so low that members fail to keep that knowledge in house, so must rely more and more on K Street.
  12. Staffers are highly partisan and highly ideological. Sixty-five percent of staffers identify as strong partisans, and almost no staffers identify as true independents. Staffers are well-sorted ideologically, such that there is little ideological overlap between Democratic and Republican offices.

Saturday, January 5, 2019

Religion in the 116th Congress

From Pew:
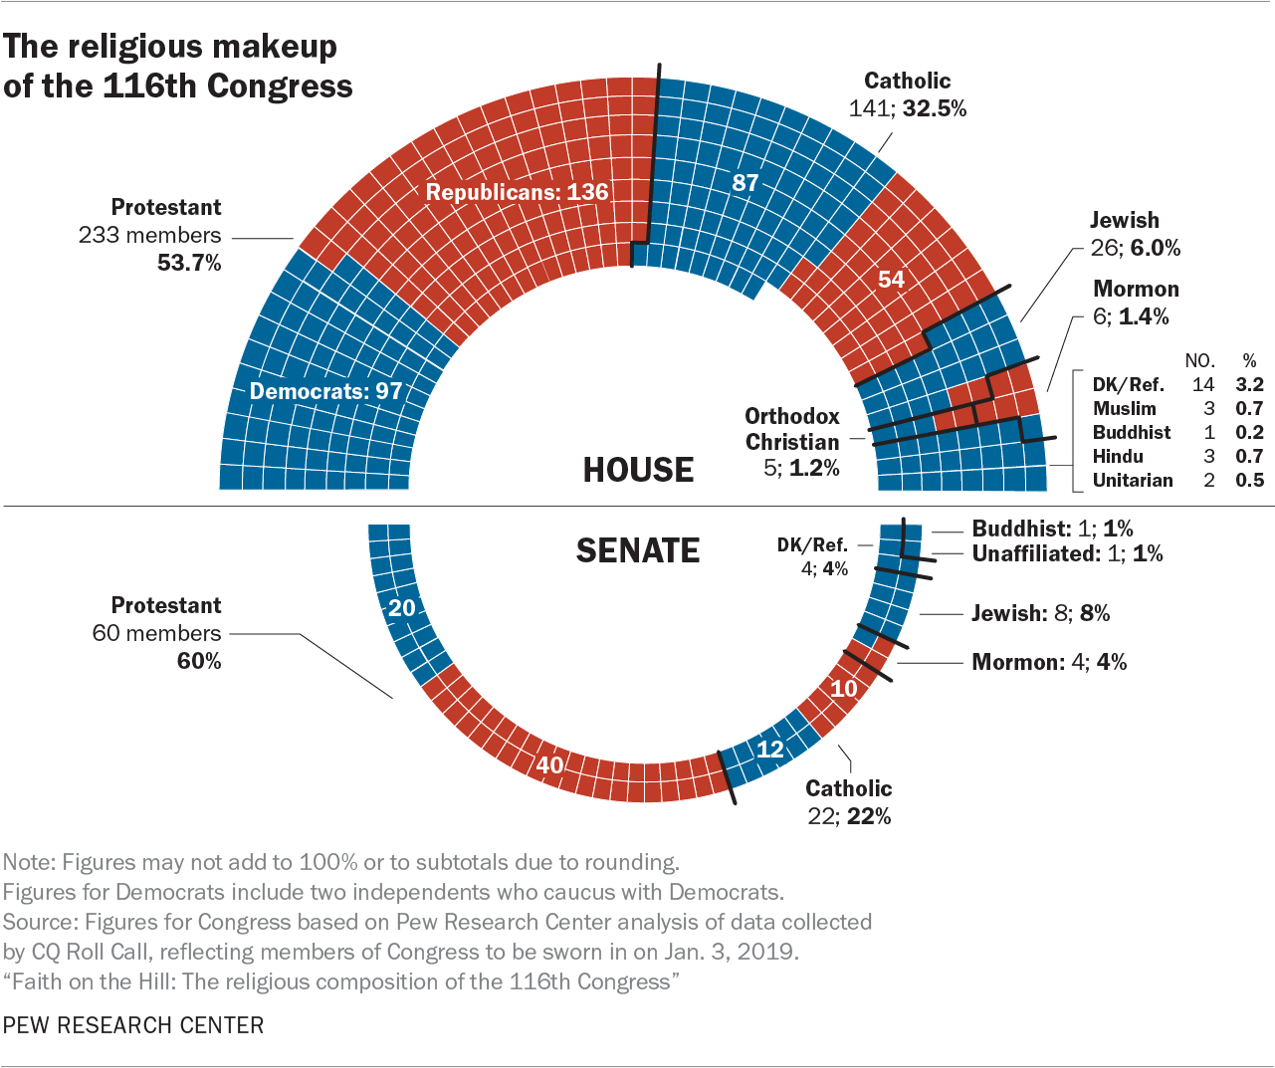
The new, 116th Congress includes the first two Muslim women ever to serve in the House of Representatives, and is, overall, slightly more religiously diverse than the prior Congress.1
...
While the number of self-identified Christians in Congress has ticked down, Christians as a whole – and especially Protestants and Catholics – are still overrepresented in proportion to their share in the general public. Indeed, the religious makeup of the new, 116th Congress is very different from that of the United States population.
...
[By] far the largest difference between the U.S. public and Congress is in the share who are unaffiliated with a religious group. In the general public, 23% say they are atheist, agnostic or “nothing in particular.” In Congress, just one person – Sen. Kyrsten Sinema, D-Ariz., who was recently elected to the Senate after three terms in the House – says she is religiously unaffiliated, making the share of “nones” in Congress 0.2%.
...
In the 116th Congress, just two of the 252 GOP members do not identify as Christian: Reps. Lee Zeldin, R-N.Y., and David Kustoff, R-Tenn., are Jewish.7
By contrast, 61 of the 282 Democrats do not identify as Christian. More than half of the 61 are Jewish (32), and 18 decline to specify a religious affiliation. Congressional Democrats also include Hindus (3), Muslims (3), Buddhists (2), Unitarian Universalists (2) and one religiously unaffiliated member. 8

 The religious makeup of the 116th Congress

Monday, February 21, 2022

Yes, Congress Does Still Pass Stuff

 Despite deadlock on high-profile controversial bills, Congress does manage to pass legislation on lower-profile issues. Russell Berman in The Atlantic

The final two-plus years of the Trump administration, for example, began with a government shutdown and featured two presidential impeachments. But they also saw the passage of a major conservation bill, a new trade agreement, significant criminal-justice reform, and several pandemic-relief packages. Lawmakers banned surprise medical billing and raised the age for purchasing tobacco from 18 to 21. Sometimes Congress does get credit for its successes. The $2.2 trillion CARES Act, passed swiftly after the coronavirus shut down huge portions of the U.S. economy in March 2020, provided some form of relief to nearly every American, as did the $1.9 trillion American Rescue Plan that Congress enacted a year later. (Not coincidentally, Gallup found that Congress’s approval rating peaked—at a still dismal 36 percent—around the time it was literally giving cash to most households.) More recently, the passage of a bipartisan infrastructure bill last year was a top story in the news.

...

Last year, Simon Bazelon and Matthew Yglesias identified this dynamic as the “Secret Congress.” Perhaps a better term would be Shadow Congress, borrowing from the label recently affixed to certain “shadow docket” rulings of the Supreme Court. These new bills, after all, are public, but relatively few care to notice. One reason they draw little attention is because the president hasn’t been fighting for them, at least not publicly. Biden has spent no time campaigning for the passage of postal reform or the arbitration ban. He’s issued only a few statements on the Violence Against Women Act, despite the fact that helping write and pass the original landmark law was one of the president’s signature accomplishments as a senator, and something he regularly touted on the 2020 campaign trail.


Contrary to assumptions about the presidential “bully pulpit,” Biden’s silence might have helped these agreements come together. [Frances] Lee’s research has shown that presidential involvement in an issue tends to increase its partisanship, which in a divided Congress usually lowers its chance of passage.

Monday, March 6, 2023

Lauren Underwood: The Personal Cost of Public Service

 At WP, Ruby Cramer has a remarkable portrait of Rep. Lauren Underwood  (D-IL):   (h/t Cheryl Bonner)

Was this what she signed up for?

Not exactly. But Lauren Underwood was here to do the job, and today, on a Friday at 11 p.m., the job was to sit in the House chamber and to wait, alert, present, attentive, for her name to be called near the end of the alphabet. So that’s what she did. She had her navy-blue blanket draped over her legs. She had cough drops and hard candy in her bag. Underwood came 405th in line, about 40 minutes into each roll call, after four Johnsons, four Smiths, three Thompsons and two Torreses. Fourteen rounds of votes and still no speaker of the House. Four days of anxiety and confusion, waiting to be sworn in. It occurred to her early on that week that the world was watching, and that Congress was not exactly putting its best foot forward. There was a grimness haunting the place. It was not a happy scene. Underwood scrolled through text messages on her phone. Across the aisle sat the new Republican majority. She heard murmurs. Then she heard yelling. The word “combustible” came to mind. She turned and saw two colleagues about to lay hands on one another — an almost-fight breaking out in the House chamber. Was she surprised? After four years in this job, no, not really. She looked back down at her phone and fired off a skull emoji to her sister. One more vote and then she could begin her third term in Congress.

...

 But she was 36 years old now. She was single. She wanted kids. She dated, but life with a member of Congress, she knew, was “not for everyone.” Like a lot of women, she had mapped out what it would mean to raise a child on her own. She had researched the costs of fertility treatments, the timeline she’d need to follow, the financial reality of paying for full-time child care on top of not just one home, in Illinois, but also an apartment in Washington, on a salary of $174,000. Like a lot of women her age, Underwood said, she had health complications that put her “firmly, permanently,” in a “high, high, high risk category” for pregnancy. She knew all the data, all the risks, in part because she had made Black maternal health her signature legislation in Congress. Like a lot of women, Underwood had made sacrifices for her work.

Saturday, September 8, 2018

Blood on Capitol Hill

Yale historian Joanne Freeman writes at NYT that the slavery conflict of the 1850s led to physical violence on Capitol Hill.

Some of the furor wasn’t slavery related; antebellum America was inherently violent, as was its politics, and Congress is a representative institution. The mighty oratory of the 1830s and ’40s was accompanied by an undercurrent of brute force. Threats and fistfights were part of the political game, and congressmen sometimes put such violence to legislative purpose.

More often than not, such bullies were Southerners or Southern-born Westerners. So-called fighting men promoted their interests and silenced their foes with insults, fists, canes, knives, pistols and the occasional brick, giving them a literal fighting advantage over “noncombatants,” who were usually Northerners. [Senator Charles] Sumner’s brutal caning was far from the only violent incident in Congress.
...

The lessons of this breakdown are severe. It shows what can happen when polarized politics erodes the process of debate and compromise at the heart of republican government. Americans lose faith in their system of government and ultimately lose faith in one another. Splintering political parties can’t contain the damage. Violence begins to seem logical, even necessary. And the press can fuel this distrust with conspiracy theories and extremist spin; the antebellum press wasn’t in the business of objectivity — and it mattered.

The destructive power of the press becomes even more marked when spread with new technologies. In the 1850s, the telegraph confronted Americans with a steady stream of virtually instant information: contradictory, confusing, overlapping and inaccurate, it scrambled and intensified the political climate. Today, social media is doing the same. At its heart, democracy is a continuing conversation between politicians and the public; it should come as no surprise that dramatic changes in the modes of conversation cause dramatic changes in democracies themselves.

At the center of this conversation is the United States Congress, the only institution in which representatives from throughout the nation come together to hash out national policy. In the 1850s, a crisis over fundamental American values and institutions — the slavery crisis — eroded the process of debate and compromise that gives Congress its purpose and power. In 2018, a crisis over different fundamentals — immigration, the rule of law, the status and safety of women and people of color — is doing much the same. If Congress’s checkered past teaches us anything on this score, it teaches this: A dysfunctional Congress can close off a vital arena for national dialogue, leaving us vulnerable in ways that we haven’t yet begun to fathom.


Sunday, April 20, 2014

The Expatriation Act

At The Los Angeles Times, Richard Simon reports:
Daniel Swalm was researching his family when he came across a disturbing episode in immigration history. That discovery would lead to a move in the U.S. Senate to apologize for action the nation took more than a century ago.
Swalm discovered that under an obscure 1907 law, his grandmother Elsie, born and raised in Minnesota, was stripped of her U.S. citizenship after marrying an immigrant from Sweden.
Swalm had never heard of the Expatriation Act that required a U.S.-born woman who married a foreigner to "take the nationality of her husband."
...
The law, passed at a time of heightened anxiety over the growing numbers of "new immigrants" from eastern and southern Europe, came in response to a belief that U.S.-born women marrying foreigners were forsaking their allegiance to the United States, [UNC historian Candice] Bredbenner said.
"A citizen woman's marriage to a foreigner became vulnerable to interpretation as a brazenly un-American act," Bredbenner wrote in her book, "A Nationality of Her Own: Women, Citizenship and the Politics of Marriage."
At the time, magazines wrote about American women marrying European nobility in pursuit of titles. "For some Americans, a titled American was an affront to American ideals," Bredbenner wrote. But thousands who lost their citizenship were average women who lived in immigrant communities, she added in an interview.
...
After women pushed to win the right to vote — secured when the 19th Amendment to the Constitution was ratified in 1920 — Congress in 1922 acted to allow most, but not all, American-born women who married foreigners to be U.S. citizens. But those who married men ineligible for citizenship, such as Chinese immigrants, still forfeited their U.S. citizenship, until that restriction was later repealed.

Monday, October 31, 2016

Veterans in Congress and the Legislatures

Our next president will not have military experience.  As a woman, Hilary Clinton was not subject to the draft.  Donald Trump used a phony medical excuse to evade the draft.  As previous posts have noted, vets much up a declining share of the membership of Congress.  Gary Schmitt and Rebecca Burgess writes at AEI:
At first blush, the decline of veterans in public office appears to be the natural consequence of the diminishing number of veterans in the overall population. With cuts in force levels following the end of the Cold War, the draft gone, and the All-Volunteer Force in place for four decades, veterans now comprise just 9 percent of the total population. Yet, when veterans made up over 70 percent of Congress in the 1970s, they were a little less than 14 percent of the total population. The decline of veterans in public office has been sharper than the decline of veterans within the general population. Why?
Perhaps the most significant reason is the current cost of running for Congress. The price tag for a Senate campaign stands near $10.5 million, the House near $1.6 million. Both political parties are likely to recruit candidates who have existing fundraising networks and abilities, with personal wealth often to boot. The high cost of political campaigns and highly restrictive campaign finance laws, which bind political parties, favor the incumbent and disadvantage the military veteran, whose earnings and savings is typically quite modest, as is his immediate circle of friends and associates.
Schmitt and Burgess point to the high cost of campaigning as one reason.  Another may be the increasing number of women, who are less likely than men to have served in the military.  But 
they note that legislatures are a congressional farm club, with about half of current members consisting of former state lawmakers.
From this perspective, the good news is that no fewer than 1,039 out of 7,383 state legislators have military experience—14 percent. While the clear majority, as in the US Congress, lean Republican, female veterans in the House, Senate, and state offices tend to break more evenly along partisan lines. And, as one might expect given the respective size of each of the services, Army veterans, from the active component, the Guard, and the Reserves, account for a majority of state and federal office holders. But each of the services, along with the Coast Guard, has veterans currently serving in the state legislatures.
As one might expect with the aging of the Vietnam-era cohort, Post-Cold War veterans make up an increasing share of all veteran state legislators. Post-9/11 veterans alone now total 20 percent of all congressional and state-level veteran legislators. And, strikingly, 41 percent of veterans running for Congress this year served after 9/11 (128 of 316).
The annual Military Family Lifestyle Survey released by Blue Star families in 2015 revealed that, when asked about their motivation for having joined the military, 95 percent of service members answered, “to serve my country.” Similarly, in a 2015 poll taken by Iraq and Afghanistan Veterans of America, the veteran population proved highly engaged and civic-minded: 93 percent were registered to vote, 80 percent reported voting in the 2014 election, and nearly 40 percent indicated they have considered running for public office.

Monday, September 11, 2017

Sunday Talk Shows

From Harvard's Shorenstein Center:
Report on Network Sunday Morning Talk Show Content and Ratings, Comparing 1983, 1999, and 2015 By Matthew A. Baum, Kalb Professor of Global Communication
Executive Summary
We studied the content and Nielsen ratings for interviews on the three network Sunday morning talk shows—Meet the Press (henceforth MTP), Face the Nation (FTN), and This Week (TW). We compared three time periods—1983 (MTP, FTN), 1999 (all three shows), and 2015 (all three shows). In order to insure apples-to-apples comparisons, for over time comparisons, we either restricted our analyses to MTP and FTN or analyzed the data with and without TW. For “overall” snapshots we included all three shows (MTP, FTN, TW).
Our goals were fourfold: (1) identify any discernable trends in the topics and types of guests featured on the Sunday talk shows, (2) identify any trends in audience ratings, (3) assess whether and to what extent trends in topics and guests correlate with audience ratings, and (4) assess whether, to what extent, and under what circumstances, the Sunday talk shows influence the subsequent news agenda.
We have seven principal findings, as follows:
  1. Content. Politics and process have, over time, increasingly supplanted substantive policy expertise and content, even while the latter types of interview guests and content earn higher ratings.
  2. Guests. Interviews with administration officials and substantive policy experts earn the highest audience ratings on average, and feature among the most substantive, policy-oriented content. Yet they are declining as proportions of all interviews
  3. Subject Matter. We find a similar, yet less pronounced, pattern for interview topics, with topics that earn the highest audience ratings not necessarily corresponding to the most frequently appearing, or most substantive, policy-oriented interview topics. However, the correlations between topic prevalence and Nielsen ratings are modest, both overall and broken out by gender.
  4. Gender Preferences. Women account for a majority of the audience since 1999, yet featured topics somewhat more closely reflect the preferences of men than of women.
  5. Guest Demographics.[1] The vast majority of guests are White men, though there is a noteworthy uptick in African American guests in 2015 relative to 1983 or 1999 and more women appeared in 2015 relative to prior years. Republican guests also substantially outnumber Democratic guests across all three periods.
  6. Agenda Setting by Members of Congress (1980-2003). Rhetoric by members of Congress from the Sunday interview programs grew less likely from 1980 to 2003 to appear in subsequent network news reports—especially discussions of the economy or budget. The exception is foreign policy, which is more likely to be picked up by later news reports.
  7. Agenda Setting Overall (1983, 1999, 2015). Looking across all guests and episodes from 1983, 1999, and 2015, (1) guests were far more likely to be featured in subsequent news reports in 1999 and 2015, relative to 1983, though much of this is attributable to 28 appearances in 2015 by Donald Trump that generated unprecedented levels of subsequent news coverage, as well as the post-1983 advent of 24-hour cable news channels; (2) Discussions of substance are more likely than discussions of process to appear in subsequent news reports; and (3) there is some, albeit limited, overlap between the topics that are the top ratings winners and those that attract the most subsequent attention in the news, with healthcare being the most noteworthy instance of such overlap. (Several additional findings are discussed in Section 7, below.)
The primary takeaway is that the Sunday morning interview shows potentially could improve their audience ratings by rebalancing their interviews to feature greater proportions of substantive policy content, relative to process-oriented, purely political content, and those types of interview guests who tend to provide more of the former relative to the latter. They might also benefit, albeit perhaps modestly so, from better matching their most commonly featured topics to those topics that attract the largest audiences, especially women, as well as by diversifying the demographics—race, gender, and even party ID—of guests. Finally, doing so is potentially beneficial not only for audience ratings, but also in terms of agenda setting—that is, earning secondary coverage of interviews in subsequent news reports.

Monday, September 14, 2026

Few Elected Officials Come Directly from the Working Class

Many posts have discussed economic and educational inequality. The effects of inequality reach many corners of American life.

Nicholas Carnes and Noam Lupu at the American Academy of Arts and Sciences:

In the United States, about half of all jobs are working-class jobs: manual-labor jobs like construction worker, service-industry jobs like home health care worker, clerical jobs like receptionist, and informal-sector jobs like day laborer. These jobs are held by men and women, young and old, from every race and religion, across every part of the country. (For more on how researchers define working class, see the Frequently Asked Questions section at the end of the report.) Working-class jobs are occupations that don’t provide employees with much material security, that don’t require capital or extensive formal education, and that don’t give employees much autonomy. These working-class jobs are indispensable to the economy and to our society: modern life in the United States is unthinkable without the people who pave roads, repair electrical lines, style hair, move freight, work in factories, deliver packages, stock shelves, build houses, repair cars, clean hotel rooms, answer phones, dig trenches, cook and serve food in restaurants, clean hospitals, ring up groceries, fix potholes, and empty garbage.

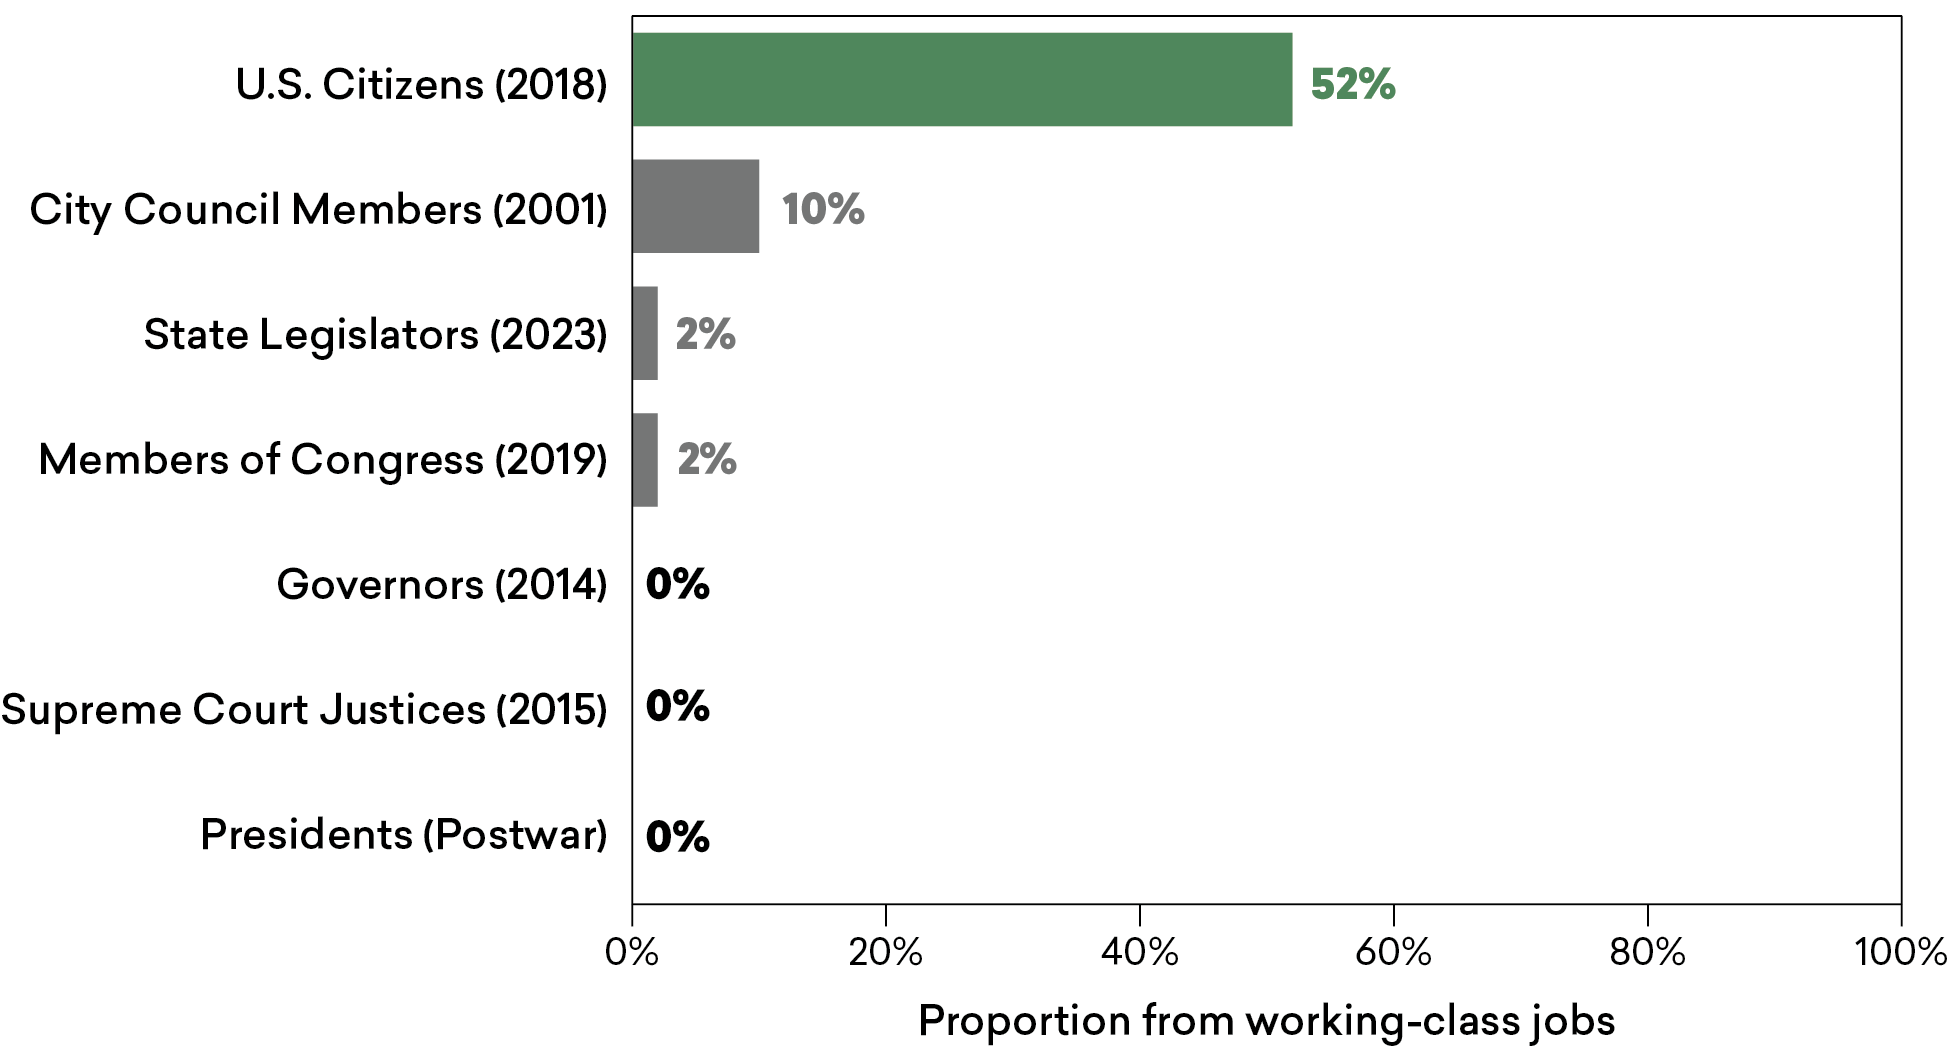
Although working-class jobs are essential to our way of life, people from working-class jobs almost never go on to hold elected political office. A 2013 study found that working-class jobs made up 52 percent of the labor force, but fewer than 10 percent of city council members had working-class jobs, fewer than 3 percent of state legislators held or had come from working-class jobs, and the typical member of Congress had spent less than 2 percent of their entire precongressional career doing the kinds of jobs that employ most Americans.1

Similar patterns have been documented in every systematic study that has ever been conducted on this topic. In 2025, researchers found that fewer than 2 percent of U.S. state legislators had working-class jobs as their main or most recent occupations.2 A 2019 analysis in The New York Times found that only 12 of the 535 members of Congress serving at that time had ever held a working-class job.3 A 1979 study by the Insurance Information Institute, an advocacy group for the insurance industry, found that just 5 percent of U.S. state legislators had working-class jobs.4 A 1954 study by a political scientist at the University of North Carolina found that just 2 percent of members of Congress had been low-salary workers, wage earners, servants, or farm laborers.5 Throughout all of U.S. history, there has never been a session of Congress in which more than 2 or 3 percent of legislators had a working-class job when they first got into politics.6
Figure 1 compares the share of working-class jobs in the U.S. labor force to the most recent data we have on the rates at which people from working-class jobs become city council members, state legislators, members of Congress, governors, Supreme Court justices, and presidents. Viewed this way, it is clear that people from working-class jobs are rare in the halls of power in the United States. If working-class people were a political party, that party would make up about half of the electorate but just tiny percentages of our political institutions.

Figure 1: Working-Class Americans Rarely Hold Public Office in the United States

A bar graph that shows the proportion of people from the working class who are U.S. citizens (52 percent, in 2018), city council members (10 percent, in 2001), state legislators (2 percent, in 2023), members of Congress (2 percent, in 2019), governors (0 percent, in 2014), Supreme Court Justices (0 percent, in 2015), and presidents (0 percent, postwar).