Search This Blog

Showing posts with label senior citizens. Show all posts

Sunday, July 19, 2026

Aging Congress

Many posts have discussed the state of Congress.

Elena Shao at NYT:
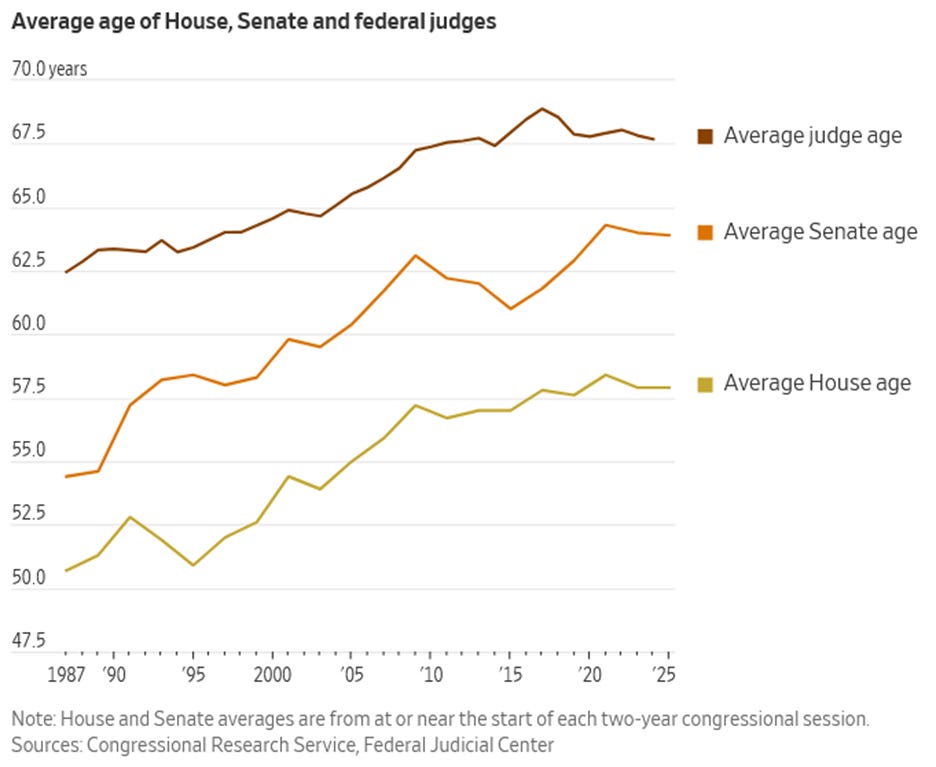
The sudden death of Senator Lindsey Graham, the 71-year-old Republican of South Carolina, has renewed criticism of an increasingly aging Congress and the systems and norms that continue to reward seniority and tenure.

More than a third of U.S. senators are 70 or older. In the Senate and the House, that age cohort has grown markedly over the past few decades, and now makes up a quarter of membership across both chambers.


Thursday, June 11, 2026

Poll on America at 250

 Many posts have discussed patriotism and American exceptionalism.

GARY FIELDS, LINLEY SANDERS and NICHOLAS RICCARDI at AP:
The survey from The Associated Press-NORC Center for Public Affairs Research highlights many Americans’ feeling of unease over the future of its representative government — particularly among young people. It presents a jarring contrast as communities around the country commemorate the nation’s 250th anniversary.

Only about one-quarter of Americans say the U.S. stands above all other countries in the world, the new poll found, while 44% say it’s one of the greatest countries in the world, along with some others. About 3 in 10 say there are better countries than the U.S., an increase from 19% in an AP-NORC poll conducted in June 2016.

Americans remain divided about whether diversity is an essential feature of the U.S.'s identity, and agreement about other aspects of the country’s underlying character appears to be eroding, the survey found. Americans are less likely to see a democratically elected government as “extremely” or “very” important to the United States’ identity as a nation than they were just a few years ago. About two-thirds of U.S. adults now say a democratically elected government is highly important to the U.S.’s identity as a nation, down from 80% in 2021.

...

Toung adults are much less likely than older Americans to believe the U.S. is special, compared with other nations, the poll found.

About 4 in 10, 44%, of U.S. adults under 30 say there are other countries better than the U.S., compared with 22% of U.S. adults ages 60 and older.

Fewer, too, see democracy as a key element of the U.S.’s identity. Only about half of Americans under 30 believe this, compared with 81% of those 60 and older.

Wednesday, June 10, 2026

Depletion Day


Lorie Konish at CNBC:
A Social Security trust fund used to pay retirement benefits may run out in late 2032, three months earlier than what had been projected last June, according to the new Social Security Administration annual trustees report released Tuesday.

Social Security uses incoming revenue from payroll taxes to pay benefits. When benefit payments exceed payroll tax income, the program relies on the trust funds to help make up the shortfall.

The report said that if the fund is depleted as projected, Social Security will only be able to pay 78% of retirement benefits.

The new projected depletion date follows the enactment of President Donald Trump’s “big beautiful” tax law, which Social Security’s chief actuary said in an August letter would have “material effects” on the financial status of the trust funds because it impacts income taxation of Social Security benefits. At that point, they estimated late 2032 for the retirement fund depletion date, pushed up from the 2025 trustees report estimate of the first quarter of 2033.

The OASI trust fund — formally known as Old-Age and Survivors Insurance, or OASI — if combined with the disability insurance trust fund, may be able to pay full benefits until the third quarter of 2034, when 83% of benefits will be payable, according to the new report. That estimate is unchanged from the prior trustees report.

The actuary's letter explained:

Because the revenue from income taxation of Social Security benefits is directed to the Social Security and Medicare trust funds, implementation of the OBBBA will have material effects on the financial status of the Social Security trust funds.  


Saturday, April 4, 2026

Federal Spending By Age

Many posts have discussed Social Security and Medicare.

Penn Wharton Budget Model:

  • In Fiscal Year 2025, federal outlays totaled over $7 trillion across 52 general spending categories. Within each of these categories, we trace spending at the line item and subcategory level to assign a total of $4.4 trillion in spending across three age groups: retirees; working-age adults; children and young adults. We classify the remaining $2.6 trillion as “all ages” because they finance broad public goods.
  • Retirees (ages 65 and older) receive $2.7 trillion, or 62 percent of the $4.4 trillion in age-assignable federal outlays, driven mainly by Social Security and Medicare.
  • Working-age adults (ages 26–64) receive $1.2 trillion, or 28 percent of age-assignable outlays, spread across Medicaid, Social Security disability benefits, veterans benefits, and Marketplace subsidies.
  • Children and young adults (under age 26) receive $449 billion, or 10 percent of age-assignable outlays, concentrated in Medicaid, SNAP, child nutrition, and education programs.
  • The heavy expenditure share on retirees is consistent with a voting model from the field of political economy. The retiree share is predicted to increase even more with an aging population and fiscal strain.

Wednesday, February 18, 2026

SCOTUS Retirements and the Ages of Justices


Supreme Court vacancies occur when Justices choose to retire or die in office. They cannot be fired by the President. So far none of the sitting Justices have indicated a desire to depart, and all are well-below the average age of departing modern Justices (79.3 since 1970). On May 7, 2026, Clarence Thomas — the oldest current Justice at 77 — will become the second-longest serving in Court history (12,614 days), with only 745 more days needed to exceed William O. Douglas’ record for longest. The President may not be the only one with eyes on the history books.


Sunday, February 8, 2026

Social Security Trust Fund Runs Empty IN JUST SIX YEARS

Many posts have discussed Social Security and Medicare.

Mark J. Warshawsky at AEI:

Despite repeated warnings over the last three decades from the Trustees, the Congressional Budget Office, and others of the projected exhaustion of the Social Security Retirement Trust Fund in the mid-2030s, and the need to change the retirement program to make it sustainable, Congress and most Presidential administrations of both political parties have ignored the problem. Similarly, attempts to simplify and modernize the vocational standards for disability benefits have gone nowhere for two decades owing to opposition. Worse still, advocates, analysts and politicians have demagogued these issues, preventing reasonable discussions and compromise. This is despite the fast approach of the exhaustion date of the retirement fund and the context of increasing budget deficits, growing debt, and long-term interest rates higher than economic growth rates. It is becoming clear that this deep-seated reluctance to deal with difficult issues will postpone any action until right up to and perhaps even after the time of fund exhaustion, like recently experienced federal government shutdowns.
   Warshawsky notes some analysts have proposed fixes but adds:

Other analysts, perhaps more jaded, have claimed that even these second-best and third best actions will not be needed, because Congress will simply decide to maintain current benefit levels and continue to increase federal borrowing and fill in the growing Social Security funding gap with general revenues when exhaustion occurs.  Indeed, it has been implicitly doing this since the cash flow to the Trust Fund turned negative in 2010.  The counterargument to this view is that the resource needs for full Social Security benefits will continue to grow, and at the same time the Social Security fund is exhausted, so too will be the Medicare fund, and the costs for Medicaid, veterans, insurance exchange subsidies, and other health programs from rising health care costs and the demographic pressures of an aging population will explode the budget.  Other budget pressures come from national security needs in a competitive, even hostile, global scene, along with rising interest rates and inflation.  Moreover, there may be political resistance in some quarters of both parties to explicitly turn Social Security into a welfare program, dependent on general revenues and the annual budget process, away from its self-contained and stable revenue sources and long-term promised benefits.  These pressures and considerations can be expected to f inally warrant some policy seriousness, albeit with much angst. 


...


Monday, December 1, 2025

Silver Tsunami

 Many posts have discussed demographic trends, especially the decline of births and the aging of the population.

Emily Peck at Axios:

A silver tsunami is washing across our shores, as record numbers of Americans start hitting retirement age. The U.S. isn't ready.

...
About 45% of Americans will experience retirement-funding shortfalls if they retire at 65, according to Morningstar's projections from last year.
...
.Out-of-pocket medical expenses are escalating, the cost of in-home care is growing more than three times faster than inflation, and an increasing share of the elderly are spending more than a third of their income on real estate too.

...
Only about 14% of Generation X (those ages 45-60) have a pension plan, according to the National Institute on Retirement Security.

...
.On paper, retirement accounts might make older Americans appear wealthy. There are an increasing number of 401(k) millionaires, after all.

But with costs and debts rising — and lifespans lengthening — older Americans might run out of money, she says, or be forced to severely cut back spending. "We have shades of the retirement crisis right now."

Between the lines: There's massive inequality when it comes to retirement readiness — workers earning more than $150,000 a year contribute nearly 13 times more toward retirement than those earning under $50,000, a report out in November found.
...
...
About 56 million Americans age 65 and older receive Social Security benefits, per federal data.
The lowest-earning workers rely on it. Social Security is the primary source of income for retirees with household incomes below $50,000, according to Transamerica's 2025 retirement survey.

A cut of 20% to 25% in Social Security benefits would have a devastating impact on retirees who rely heavily or solely on those payments," said Kristi Martin Rodriguez, who leads the Nationwide Retirement Institute. "61% of current recipients say missing even half of a payment would leave them unable to survive financially."


Saturday, October 25, 2025

Boomers

 Many posts have discussed demographic trends, especially the decline of births and the aging of the population.


A 2018 campaign video:


Tuesday, October 29, 2024

Presidential Age

 David Lawler at Axios:

Vice President Kamala Harris turns 60 on Sunday, though she might not have much time to celebrate with just 16 days until Election Day.

The big picture: Harris is older than the median age of a U.S. president (55) at inauguration. But she's a political generation younger than President Biden (81) and her opponent, former President Trump (78), who would surpass Biden to become the oldest person ever elected.Age took on an outsized role in the 2024 race when Biden was on the ticket, as many voters felt he was too old to be president.
More recently, Trump's age and acuity have been under scrutiny.

By the numbers: Trump and Biden have bent the presidential age curve upward (see chart). Just 12 presidents have taken office in their 60s or 70s.

Prior to Trump, Ronald Reagan (69) was the oldest president elected for the first time. He was 77 when he left office after two terms, still a year younger than Trump is now.
  • The youngest presidents ever elected were Teddy Roosevelt (42) and John F. Kennedy (43). Since Kennedy, the youngest were Barack Obama (47) and Bill Clinton (46).
  • Jimmy Carter, meanwhile, is the longest-lived president ever, at 100. He cast a mail-in ballot for Harris on Wednesday.


Friday, July 26, 2024

Reasons for Not Having Children

Many posts have discussed demographic trends, especially the decline of births and the aging of the population.

Rachel Minkin et al. at Pew:

The U.S. fertility rate reached a historic low in 2023, with a growing share of women ages 25 to 44 having never given birth.

And the share of U.S. adults younger than 50 without children who say they are unlikely to ever have kids rose 10 percentage points between 2018 and 2023 (from 37% to 47%), according to a Pew Research Center survey.

In this report, we explore the experiences of two groups of U.S. adults: 
  • Those ages 50 and older who don’t have children
  • Those younger than 50 who don’t have children and say they are unlikely to in the future
About four-in-ten of those in the older group (38%) say there was a time when they wanted to have children. A smaller but sizable share (32%) say they never wanted children, and 25% say they weren’t sure one way or the other. Few say they frequently felt pressure to have children from family, friends or society in general. 


Tuesday, June 25, 2024

Immigration and Social Security

Many posts have discussed Social Security.

Tara Watson at Brookings:

The Social Security system faces a solvency crisis. It is mostly a “pay-as-you-go” system in that payroll taxes from current workers support current retirees. There is also a trust fund to finance the Social Security benefits of the unusually large cohort of retirees in the Baby Boomer generation (born 1946-1964, who turn 62—the earliest claiming age for those without disabilities—between 2008-2026). The Old-Age, Survivors, and Disability Insurance (OASDI) trust fund is expected to deplete in 2034, at which point there will only be enough funds coming into the system to cover about 75% of promised benefits. Over the 75-year projection window, the Social Security actuaries project a shortfall of 3.61% of taxable payroll, and the CBO suggests a deficit of 5.1% . To square the circle, more revenues need to be raised or benefits need to be cut. Similarly, the 2023 Medicare report suggests that the hospital insurance(HI) trust fund will be depleted in 2031 and the 75-year actuarial deficit is 0.62% of taxable payroll.

Immigrants contribute to both systems. Immigrants with permanent status and dual intent temporary visas are subject to the payroll tax which finances Social Security and Medicare. In addition, some undocumented immigrants work in formal sector jobs using a false Social Security Number; in 2013 it was estimated that the contributions to the Social Security system without a corresponding beneficiary totaled $13 billion. Temporary immigrants without a pathway to permanent status, such as seasonal workers, do not pay into the system.

Of course, many long-term immigrants are recipients of Social Security after they have contributed. On net, however, immigration is a fiscal positive for the Social Security system over a 75-year horizon. In their 2023 report, the Social Security Trustees estimate a 75-year Social Security shortfall of 3.61% of taxable payroll under their midline immigration assumptions. But that number fluctuates from a 3.21% with a high immigration scenario to a 4.02% deficit in the low immigration scenario

Monday, February 26, 2024

The Graying of America, 21st Century

 CBO:

The size of the U.S. population, as well as its age and sex composition, has significant implications for the economy and the federal budget. For example, the number of people ages 25 to 54 affects the number of people employed, and the number of people age 65 or older affects the number of Social Security and Medicare beneficiaries.

In this report, the Congressional Budget Office describes its population projections, which underlie the agency’s baseline budget projections and economic forecast that will be published in early 2024.

  • Population. In CBO’s projections, the Social Security area population—the relevant population for estimating Social Security payroll taxes and benefits and the measure of population used in this report—increases from 342 million people in 2024 to 383 million people in 2054. As growth of the population age 65 or older outpaces growth of younger age groups, the population continues to become older, on average.
  • Population Growth. Population growth generally slows over the next 30 years, from 0.6 percent per year, on average, between 2024 and 2034 to 0.2 percent per year, on average, between 2045 and 2054. Net immigration increasingly drives population growth and accounts for all population growth beginning in 2040, in part because fertility rates remain below the rate that would be required for a generation to replace itself in the absence of immigration.
  • Civilian Noninstitutionalized Population. The civilian noninstitutionalized population—which consists of people age 16 or older who are not members of the armed forces on active duty and who are not in penal or mental institutions or in homes for the elderly or infirm—grows from 271 million people in 2024 to 310 million people in 2054, expanding by 0.4 percent per year, on average. The number of people ages 25 to 54 (who are more likely to work than people in other age groups) grows at an average annual rate of 0.3 percent over that period—more slowly than in recent decades.


Friday, February 16, 2024

Measuring Identity

Scott Keeter, Anna Brown, and Dana Popky at Pew:
Unlike most Pew Research Center reports, where the emphasis is on original research and the presentation of findings, our goal here is to explain how we do this – that is, how we measure some of the most important core characteristics of the public, which we then use to describe Americans and talk about their opinions and behaviors.

To do so, we first chose what we judged to be the most important personal characteristics and identities for comparing people who take part in our surveys. Then, for each trait, we looked at a range of aspects: why and how it came to be important to survey research; how its measurement has evolved over time; what challenges exist to the accurate measurement of each; and what controversies, if any, remain over its measurement.

These considerations and more shape how we at Pew Research Center measure several important personal characteristics and identities in our surveys of the U.S. public. Here are some things to know about key demographic questions we ask:
  • Our main religion question asks respondents to choose from 11 groups that encompass 98% of the U.S. public: eight religious groups and three categories of people who don’t affiliate with a religion. Other, less common faiths are measured by respondents writing in their answer. Our questions have evolved in response to a rise in the share of Americans who do not identify with any religion and to the growing diversity in the country’s population. (Chapter 1)
  • Measuring income is challenging because it is both sensitive and sometimes difficult for respondents to estimate. We ask for a person’s “total family income” the previous calendar year from all sources before taxes, in part because that may correspond roughly to what a family computed for filing income taxes. To reduce the burden, we present ranges (e.g., “$30,000 to less than $40,000”) rather than asking for a specific number. (Chapter 2)
  • We ask about political party affiliation using a two-part question. People who initially identify as an independent or “something else” (instead of as a Republican or Democrat) and those who refuse to answer receive a follow-up question asking whether they lean more to the Republican Party or the Democratic Party. In many of their attitudes and behaviors, those who only lean to a party greatly resemble those who identify with it. (Chapter 3)
  • Our gender question tries to use terminology that is easily understood. It asks, “Do you describe yourself as a man, a woman or in some other way?” Amid national conversation on the subjects, gender and sexual orientation are topics on the cutting edge of survey measurement. (Chapter 4)
  • In part because we use U.S. Census Bureau estimates to statistically adjust our data, we ask about race and Hispanic ethnicity separately, just as the census does. People can select all races that apply to them. In the future, the census may combine race and ethnicity into one question. (Chapter 5)
  • A person’s age tells us both where they fall in the life span, indicating what social roles and responsibilities they may have, and what era or generation they belong to, which may tell us what events in history had an effect on their political or social thinking. We typically ask people to report just the year of their birth, which is less intrusive than their exact date of birth. (Chapter 6)


Wednesday, October 25, 2023

Attention to Political News

Jeffrey M. Jones at Gallup:
There are wide differences in the amount of attention paid to national political news by age and educational attainment. In the current survey, 51% of U.S. adults aged 65 and older say they follow political news very closely, as do 40% of those between the ages of 50 and 64. Far fewer 30- to 49-year-olds (26%), and especially 18- to 29-year-olds (9%), are following politics very closely.

More than four in 10 college graduates (including those with and without a postgraduate education) follow political news very closely, while fewer than three in 10 adults without a college degree do.

There are modest gender differences in attention to politics, with more men (35%) than women (30%) following politics very closely. Republicans and Democrats pay similar levels of attention, but independents pay less than either of the two major party groups.

These subgroup differences are similar to what Gallup has observed since 2001, although the levels of attention measured in the 2023 poll are lower than usual for postgraduates and young adults and higher for senior citizens. Postgraduates typically pay the closest attention to politics, with an average of 51% doing so since 2001.

Monday, July 31, 2023

Gerontocracy

April Rubin at Axios:
American leadership is getting older.
Why it matters: With baby boomers making up half of Congress, the conversation on aging and health in public office from the Capitol to the White House isn't going away.The 118th Congress is one of the oldest in U.S. history — and drives debates about fitness for office, term limits and ageism.

The big picture: Top House Democrats stepped aside late last year to make room for a younger generation of leaders — a shift that's been less apparent in the Senate, particularly among Republicans.Those Democrats, including former Speaker Nancy Pelosi, "made way for a younger generation of leadership," John Mark Hansen, a political science professor at the University of Chicago, told Axios. "And that's pretty unusual and pretty striking."

...

By the numbers: The average age of members of Congress is 58 years old.

Thursday, July 6, 2023

Changing Demographics

 From the Census:

JUNE 22, 2023 — The nation’s median age increased by 0.2 years to 38.9 years between 2021 and 2022, according to Vintage 2022 Population Estimates released today by the U.S. Census Bureau. Median age is the age at which half of the population is older and half of the population is younger.

“As the nation’s median age creeps closer to 40, you can really see how the aging of baby boomers, and now their children — sometimes called echo boomers — is impacting the median age. The eldest of the echo boomers have started to reach or exceed the nation’s median age of 38.9,” said Kristie Wilder, a demographer in the Census Bureau’s Population Division. "While natural change nationally has been positive, as there have been more births than deaths, birth rates have gradually declined over the past two decades. Without a rapidly growing young population, the U.S. median age will likely continue its slow but steady rise.”

A third (17) of the states in the country had a median age above 40.0 in 2022, led by Maine with the highest at 44.8, and New Hampshire at 43.3. Utah (31.9), the District of Columbia (34.8), and Texas (35.5) had the lowest median ages in the nation. Hawaii had the largest increase in median age among states, up 0.4 years to 40.7.

...


Tuesday, July 4, 2023

National Pride 2023

 Megan Brenan at Gallup::

At 39%, the share of U.S. adults who are “extremely proud” to be American is essentially unchanged from last year’s 38% record low. The combined 67% of Americans who are now extremely or “very proud” (28%) also aligns with the historically subdued 65% reading one year ago.

Another 22% of U.S. adults currently say they are “moderately proud,” while 7% are “only a little” and 4% “not at all.”
...
Party identification remains the greatest demographic differentiator in expressions of national pride, and Republicans have been consistently more likely than Democrats and independents to express pride in being American throughout the trend. That gap has been particularly pronounced since 2018, with more than twice as many Republicans as Democrats saying they are extremely proud. Republicans are also nearly twice as likely as independents to express the highest degree of pride.

The latest findings, from a June 1-22 Gallup poll, show 60% of Republicans and 29% of Democrats expressing extreme pride in being American. Both figures are statistically similar to last year’s readings. Independents’ current 33% extreme pride is also essentially unchanged, but it is their lowest on record by one percentage point.

...

In addition to party identification, age appears to significantly affect Americans’ national pride. Whereas 50% of U.S. adults aged 55 and older say they are extremely proud to be American, 40% of those aged 35 to 54 and 18% of 18- to 34-year-olds say the same.

Aggregated data from 2020 to 2023 provide a sufficient sample for analysis and show that younger adults in all party groups are significantly less proud than older adults of the same political persuasion.