Search This Blog

Showing posts with label population. Show all posts

Monday, June 29, 2026

The Districts Are Too Damn Big

Many posts have discussed reapportionment and redistricting.  There have long been proposals to enlarge the House, thereby creating less populous districts.


Bruce Mehlman:

At the Constitutional Convention, George Washington spoke only once — to urge that representation remain close to the people, with a ratio of one representative for every 30,000. For more than a century, Congress followed that blueprint, with the House growing steadily from 65 members in 1789 to 435 by 1913. And then it stopped. Today, the actual ratio is roughly one representative for every 760,000 Americans. Is there any population at which a House district becomes too big to represent?


Thursday, August 21, 2025

Foreign-Born Population

 Many posts have discussed immigration.

Stephanie Kramer and Jeffrey S. Passel at Pew:

As of June 2025, 51.9 million immigrants lived in the U.S., making up 15.4% of the nation’s population. This was down from January, when there were a record 53.3 million immigrants in the U.S., accounting for 15.8% of the country’s population – the highest percentage on record.

Even as the nation’s immigrant population has declined in recent months – a change that may be partly artificial due to a declining survey response rate among immigrants – the U.S. is home to more immigrants than any other country 


Thursday, July 17, 2025

Demographics, Inflation, Social Security, and Medicare

Many posts have discussed Social Security and Medicare.

James C. Capretta at AEI:

During the raucous debate surrounding the GOP-sponsored reconciliation bill, the trustees for Social Security and Medicare rather quietly released their annual reports on the status of the programs’ respective trust funds. Their projections once again show that it will not be easy to stabilize the fiscal outlook without closing the widening gap between how much is spent on these entitlement programs compared to the dedicated taxes and premiums collected to pay for them.

The core problem is a transformative demographic shift that was not anticipated when the programs were established. In 1935, when Congress approved the original Social Security law, and again in 1965, when Medicare was created, the expectation was that birth rates would remain close to their historical levels. That proved to be a costly misjudgment as family sizes began to fall sharply starting in the early 1960s and then continued to decline in the succeeding decades.

Further, while there was an expectation of improvement in average lifespans, the progress has been more rapid than anticipated.

Finally, with Medicare and Medicaid providing insurance coverage starting in the 1960s, demand for services rose precipitously, as did the prices charged by hospitals and doctors. With few exceptions, annual spending on health care has been rising more rapidly than incomes for most of the last half-century.


Wednesday, January 15, 2025

Without Immigration, Shrinkage!

  Many posts have discussed population and immigration.

CBO, The Demographic Outlook: 2025 to 2055

The size of the U.S. population and its composition by age and sex have significant implications for the economy and the federal budget. In CBO’s projections, the U.S. population increases from 350 million people in 2025 to 372 million in 2055. The rate of population growth generally slows over the next 30 years, from an average of 0.4 percent a year between 2025 and 2035 to an average of 0.1 percent a year between 2036 and 2055. Net immigration becomes an increasingly important source of population growth. Without immigration, the population would shrink beginning in 2033, in part because fertility rates are projected to remain too low for a generation to replace itself.


Sunday, October 13, 2024

Depopulation


Nicholas Eberstadt at Foreign Affairs:
Although few yet see it coming, humans are about to enter a new era of history. Call it “the age of depopulation.” For the first time since the Black Death in the 1300s, the planetary population will decline. But whereas the last implosion was caused by a deadly disease borne by fleas, the coming one will be entirely due to choices made by people.

With birthrates plummeting, more and more societies are heading into an era of pervasive and indefinite depopulation, one that will eventually encompass the whole planet. What lies ahead is a world made up of shrinking and aging societies. Net mortality—when a society experiences more deaths than births—will likewise become the new norm. Driven by an unrelenting collapse in fertility, family structures and living arrangements heretofore imagined only in science fiction novels will become commonplace, unremarkable features of everyday life.
,,,'

The United States remains the main outlier among developed countries, resisting the trend of depopulation. With relatively high fertility levels for a rich country (although far below replacement—just over 1.6 births per woman in 2023) and steady inflows of immigrants, the United States has exhibited what I termed in these pages in 2019 “American demographic exceptionalism.” But even in the United States, depopulation is no longer unthinkable. Last year, the Census Bureau projected that the U.S. population would peak around 2080 and head into a continuous decline thereafter.

...

As for the United States, the demographic fundamentals look fairly sound—at least when compared with the competition. Demographic trends are on course to augment American power over the coming decades, lending support for continued U.S. global preeminence. Given the domestic tensions and social strains that Americans are living through today, these long-term American advantages may come as a surprise. But they are already beginning to be taken into account by observers and actors abroad.

Although the United States is a sub-replacement society, it has higher fertility levels than any East Asian country and almost all European states. In conjunction with strong immigrant inflows, the United States’ less anemic birth trends give the country a very different demographic trajectory from that of most other affluent Western societies, with continued population and labor-force growth and only moderate population aging in store through 2050.

 Thanks in large measure to immigration, the United States is on track to account for a growing share of the rich world’s labor force, youth, and highly educated talent. Continuing inflows of skilled immigrants also give the country a great advantage. No other population on the planet is better placed to translate population potential into national power—and it looks as if that demographic edge will be at least as great in 2050. Compared with other contenders, U.S. demographics look great today—and may look even better tomorrow—pending, it must be underscored, continued public support for immigration. The United States remains the most important geopolitical exception to the coming depopulation.


Sunday, March 17, 2024

Declining Ranks of Irish Americans

In 2017, Drew DeSilver reported at Pew:
In 2015, 32.7 million Americans, or one-in-ten, identified themselves as being of Irish ancestry, making it the second-largest ancestry group in the U.S. after Germans. In addition, nearly 3 million Americans claimed Scotch-Irish ancestry, or just under 1% of the entire population. (The Scotch-Irish were mainly Ulster Protestants who migrated to the British colonies in the decades before independence, while Irish Catholics didn’t begin arriving in large numbers until the 1840s.) By comparison, the Republic of Ireland and Northern Ireland have a combined population of about 6.6 million. 
The ranks of both Irish and Scotch-Irish Americans have fallen a lot in the past two-and-a-half decades, and the trend does not appear likely to reverse. Two decades ago, in 1990, 38.7 million Americans (15.6% of the total population) claimed Irish ancestry, and 5.6 million (2.3%) identified as Scotch-Irish.

Both ancestral groups are older than the U.S. population as a whole. In 2013, the median age of those claiming Irish ancestry was 40.5, and 52.1 for those of Scotch-Irish ancestry, versus a median age of 37.8 for the entire population. Nor are the Irish immigrating to the U.S. in anything close to the numbers they used to: In fiscal 2015, according to Department of Homeland Security statistics, just 1,607 Irish-born people obtained legal permanent residency.

The trend has continued.  From the Census:

30.7 million or 9.2% The number and percentage of U.S. residents who claimed Irish ancestry in 2022. Source: 2022 American Community Survey 1-year estimates

112,251 The number of foreign-born U.S. residents who reported Ireland as their birthplace in 2022. Source: 2022 American Community Survey 1-year estimates

And in fiscal 2022, the number of Irish people obtaining legal permanent residency was just 1,407. 


Monday, February 26, 2024

The Graying of America, 21st Century

 CBO:

The size of the U.S. population, as well as its age and sex composition, has significant implications for the economy and the federal budget. For example, the number of people ages 25 to 54 affects the number of people employed, and the number of people age 65 or older affects the number of Social Security and Medicare beneficiaries.

In this report, the Congressional Budget Office describes its population projections, which underlie the agency’s baseline budget projections and economic forecast that will be published in early 2024.

  • Population. In CBO’s projections, the Social Security area population—the relevant population for estimating Social Security payroll taxes and benefits and the measure of population used in this report—increases from 342 million people in 2024 to 383 million people in 2054. As growth of the population age 65 or older outpaces growth of younger age groups, the population continues to become older, on average.
  • Population Growth. Population growth generally slows over the next 30 years, from 0.6 percent per year, on average, between 2024 and 2034 to 0.2 percent per year, on average, between 2045 and 2054. Net immigration increasingly drives population growth and accounts for all population growth beginning in 2040, in part because fertility rates remain below the rate that would be required for a generation to replace itself in the absence of immigration.
  • Civilian Noninstitutionalized Population. The civilian noninstitutionalized population—which consists of people age 16 or older who are not members of the armed forces on active duty and who are not in penal or mental institutions or in homes for the elderly or infirm—grows from 271 million people in 2024 to 310 million people in 2054, expanding by 0.4 percent per year, on average. The number of people ages 25 to 54 (who are more likely to work than people in other age groups) grows at an average annual rate of 0.3 percent over that period—more slowly than in recent decades.


Wednesday, December 20, 2023

California: The Exodus of the Affluent

 Don Lee at LAT

In 2021 and 2022, about 750,000 more people left the state than moved in, according to recently released Census Bureau data. That was about as many as the total net loss of residents for all five years before the COVID-19 pandemic in early 2020.

But it’s not just the sheer numbers of people who have left. What’s different is that in each of the prior two years, more than 250,000 Californians with at least a bachelor’s degree moved out, while an average of 175,000 college graduates from other states settled in California, according to an analysis of census data by William Frey, a demographer at the Brookings Institution.

In prior periods over the last two decades, that balance was about even or slightly in California’s favor, even though the state consistently lost many more residents overall to other states than it gained from them. The recent out-migration has been particularly pronounced among Californians with graduate and professional degrees.

California is heavily dependent on high earners to meet government fiscal needs. Tax filers in the top 1% of income, earning around $1 million and above, have typically accounted for 40% to 45% of the state’s total personal income tax revenue, said Brian Uhler, deputy legislative analyst at California’s Legislative Analyst’s Office, which estimated the $68-billion budget deficit.
...

In the tax filing years 2020 and 2021, the average gross income of taxpayers who had moved from California to another state was about $137,000. That was up from $75,000 in 2015 and 2016, according to migration and personal income data from the Internal Revenue Service.

IRS and other data show that Texas has long been, by far, the top destination for Californians. And in the years 2015-16, an individual or couple who had moved from California to Texas reported an average income of $78,000, about the same as Texans who relocated to California. But by 2020-2021, California transplants in Texas reported an average income of about $137,000, while tax returns from former Texans who moved to California showed an average income of $75,000.

The income gap between those coming into California and those going out is even bigger when it comes to Florida, which, as far away as it is, has become a top five destination for emigrating Californians. Statistics show more older Californians are likely to move there. Florida, like Texas and Nevada and Tennessee, another more recent hot spot for Californians, doesn’t have a personal income tax.

In California, the top tax rate for personal income is 12.3%.

Sunday, October 29, 2023

California Update: Losing Population, Flunking Computer Science

New data from the U.S. Census shows that around 820,000 people moved out of California and 550,000 out of New York in 2022. They join more than 8 million Americans who moved states in 2022.

Why it matters: The rising cost of living is pushing people out of expensive coastal areas, and the trend doesn't look likely to change in coming years: four in ten Californians and and three in ten New Yorkers say they're considering moving out of state.
  • Many of those moving are headed to Florida or Texas, the states with the largest influxes in 2022.
  • But Texans worried about the "California-ing" of their state may not need to worry: Democrats are much more likely to move to blue states, while Republicans move to red states.
Carolyn Jones at CalMatters:
Five years ago, California embarked on an ambitious plan to bring computer science to all K-12 students, bolstering the state economy and opening doors to promising careers — especially for low-income students and students of color.

But a lack of qualified teachers has stalled these efforts, and left California — a global hub for the technological industry — ranked near the bottom of states nationally in the percentage of high schools offering computer science classes.

“I truly believe that California’s future is dependent on preparing students for the tech-driven global economy. You see where the world is going, and it’s urgent that we make this happen,” said Allison Scott, chief executive officer of the Kapor Foundation, an Oakland-based organization that advocates for equity in the technology sector.

Scott was among those at a conference in Oakland this week aimed at expanding computer science education nationally. While some states — such as Arkansas, Maryland and South Carolina — are well on their way to offering computer science to all students, California lags far behind. According to a 2022 report by Code.org, only 40% of California high schools offer computer science classes, well below the national average of 53%.

California’s low-income students, rural students and students of color were significantly less likely to have access to computer science classes, putting them at a disadvantage in the job market, according to a 2021 report by the Kapor Center and Computer Science for California.


Monday, September 11, 2023

Sticky States


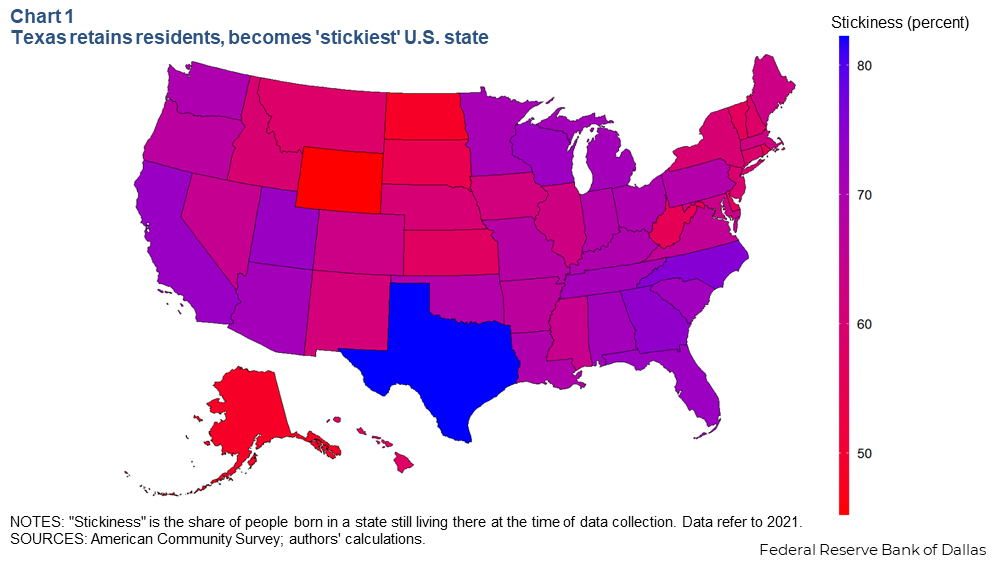
The share of people born in a state and who stay there can provide an important measure of its attractiveness to workers. The stickiness of native residents is also key to maintaining a stable (or growing) population and workforce, which is vital to economic growth.

To figure out which states are best at retaining their native residents, we calculated the stickiness of each state. Using American Community Survey (ACS) data, we estimated the share of people born in each state who still lived in that state as of the 2021 survey (Chart 1).

Chart 1

Downloadable chart | Chart data

Texas is the stickiest state in the country by far, with approximately 82 percent of native Texans still living here in 2021. Other sticky states include North Carolina (75.5 percent), Georgia (74.2 percent), California (73.0 percent) and Utah (72.9 percent).

At the other end of the spectrum, Wyoming is the least-sticky state, with only 45.2 percent of natives remaining there. North Dakota and Alaska were the only other states with less than half their native population staying there (48.6 percent and 48.7 percent, respectively). Rhode Island (55.2 percent) and South Dakota (54.2 percent) round out the bottom five.

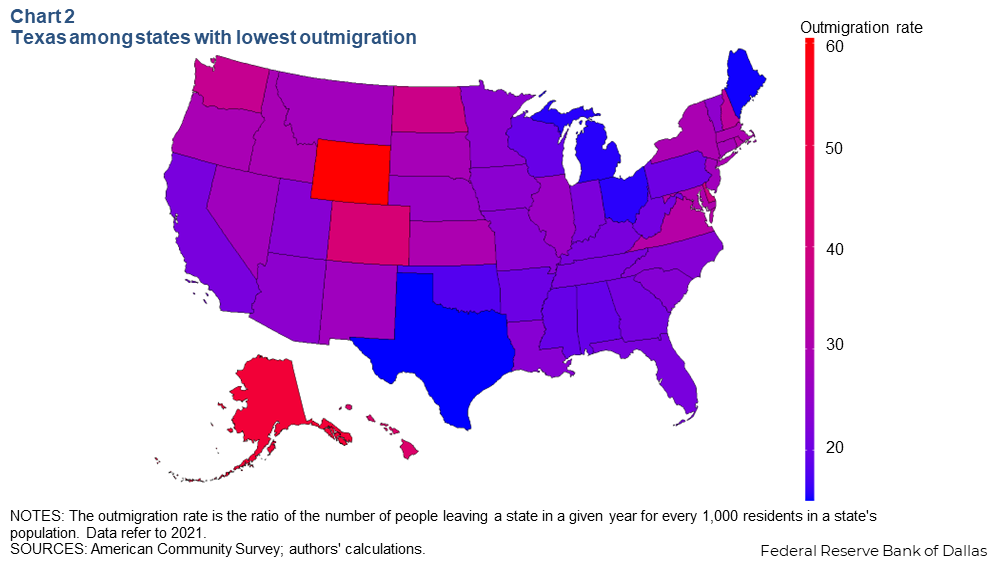
Notably, the least-sticky states tend to see high levels of outmigration of everyone—not just their native residents (Chart 2).Downloadable chart | Chart data


Overall outmigration numbers track everyone moving from one state to another state, including both people born there and those who moved there before leaving, making them a better indicator of population flows.

In addition to being the stickiest state, Texas had the lowest outmigration rate in 2021, followed by Maine and Michigan. Wyoming, Alaska and Hawaii experienced the highest outmigration rates.

Tuesday, June 6, 2023

New York and California are Losing Affluent Taxpayers

 Justin Fox at Bloomberg:

New York has been losing people to other states for a while. But something new happened during the pandemioc: The people who left had higher incomes than those who stayed behind — much higher.

The 2020-21 numbers here were released in late April by the Internal Revenue Service. They sort taxpayers by whether and where they moved between filing their taxes in 2020 and filing them in 2021; the adjusted gross incomes are for the 2020 tax year. It has been two years since May 17, 2021 — that year’s belated income tax filing deadline — and a lot has changed. But New York has continued to lose population, and if the trend depicted above were to continue, even in less extreme form, it would be disastrous for the finances of a state that relies on income taxes paid by those making $200,000 or more a year for almost half its revenue. (That is, before the pandemic in 2019, personal income taxes accounted for 65% of state revenue, and those making $200,000 or more paid 71% of the income taxes.)

...

The role of taxes in driving interstate migration is often exaggerated, but it’s not nothing. In a couple of recent papers, Joshua Rauh of the Stanford Graduate School of Business has shown that the percentage of very-high-income taxpayers leaving California jumped in the wake of one, a 2013 increase in the state’s top income tax rate, two, the 2017 Tax Cuts and Job Act’s curtailing of state and local tax deductions and three, the pandemic. Still, that’s not many people and for years those leaving California and New York have been mainly lower— and middle-income residents for whom expensive housing and other cost-of-living issues probably played a bigger role than tax rates per se.

In New York, the initial pandemic exodus was led by those who could afford to leave quickly and could work remotely. The composition seems to have shifted since then, with affluent Manhattan gaining population from mid-2021 to mid-2022, according to Census Bureau estimates, and the state’s poorest county, the Bronx, losing the biggest percentage of population. (The recent New York Times analysis showing an accelerating exodus of college graduates from the New York City metro area relies on different Census numbers that aren’t available yet for 2022.) New York has been finding all sorts of different ways to drive away all sorts of different people — and it looks as if that’s about to start seriously hampering the state’s ability to pay its bills.


Saturday, May 27, 2023

Census: Aging America

 From the Census Bureau:

Today, the U.S. Census Bureau released the 2020 Census Demographic Profile and Demographic and Housing Characteristics File (DHC). These products provide the next round of data available from the 2020 Census, adding more detail to the population counts and basic demographic and housing statistics previously released for the purposes of congressional apportionment and legislative redistricting.

... 
  • The 2020 Census shows the following about the nation’s age and sex composition: Between 2010 and 2020, median age in the U.S. grew older due to an increase in the older population.In 2020, there were 55.8 million people age 65 and over in the United States (16.8% of the total population), up 38.6% from 40.3 million in 2010. This growth primarily reflected the aging baby boom cohort.
  • Centenarians grew 50% since 2010, the fastest recent census-to-census percent change for that age group
...
  • In 1970, after all the Baby Boomers (1946-1964) had been born, half of the population was younger than 28.1 years old. By 2020, the median age was 38.8, an increase of more than 10 years over the past five decades.In 2020, the population age 45 and over accounted for 42% of the total population, up from 27% in 1940, the census before the Baby Boom began.
  • The share of the population age 65 and over more than doubled between 1940 and 2020, from less than 7% to nearly 17%.
  • In 2020, there were over 73.1 million children under age 18 (22.1% of the total U.S. population), down 1.4% from 74.2 million in 2010. The biggest decline was among the under-5 age group, whose share of the population dropped by 8.9% or 1.8 million. This finding is consistent with the decline in the total number of births and the birth rate for the United States since 2015.
  • Among the states in 2020:Fourteen states had a median age over 40, twice as many as in 2010. Twenty-five states had higher shares of population age 65 and older than Florida had in 2010 (17.3%), when it had the highest share of any state. In 2020, Maine had the highest share at 21.8%, followed by Florida (21.2%) and Vermont (20.6%).
  • Utah and Maine were the youngest and oldest states (as they were in 2010). Nearly half of Utah’s population was under age 31 while more than half of Maine’s population was over age 45.

...

The public can explore these age and sex statistics in two data visualizations:
Exploring Age Groups in the 2020 Census. This interactive map shows certain measures — percent of population, percent change from 2010, percent female and racial and ethnic diversity index and prevalence — for a variety of age groups for the nation, states, counties and census tracts. The visualization also provides ranking lists of the measures.
How Has Our Nation's Population Changed? This interactive visualization shows population pyramids and ranked age and sex measures for the total population, as well as race and Hispanic origin groups, for the nation, states, metropolitan areas, micropolitan areas and counties in 2020, 2010 and 2000.

A series of downloadable ranking tables related to each visualization is also available.

More information about age and sex is also available in the America Counts stories: An Aging U.S. Population With Fewer Children in 2020 and 2020 Census: 1 in 6 People in the United States Were 65 and Over, and two briefs: Age and Sex Composition: 2020 and The Older Population: 2020.


Thursday, May 11, 2023

Enlarging the House: Practical Considerations

Danielle Allen at WP:
A system requiring one person to represent the interests of almost 1 million people would have troubled Washington — as it should us. But let’s set his ratio aside for a moment. In a previous column, I argued for a bill put forward by Rep. Earl Blumenauer (D-Ore.) that would bring us to 585 seats. And after that initial step up, we could transition to “a cube root rule” — pegging the number of House members to the cube root of the national population — for growth in subsequent census years. In this way, the size of the House would increase continually with the population but at a steady and manageable rate. Based on population projections, this would put us on track for a Congress that would grow from 435 to 585 to 736 over the next 40 years.

But what would happen to the Capitol? Wouldn’t we need a new building? Doesn’t that make this impossible?

The Capitol has already undergone multiple extensions. In 1850, growth in membership led to a major renovation project. By 1869, the work delivered the Capitol that we know now. But even after the Capitol was complete that year, the House continued to grow. In the 1870s, it grew from 243 to 293 members, continuing up to the current 435, established in 1929.
And here’s the extraordinary thing: It still has room for more growth — quite a bit of it.

I engaged architect Michael Murphy to explore what is possible. Murphy is a visionary designer committed to architecture for the public good. He designed Bryan Stevenson’s National Memorial for Peace and Justice — the memorial for lynching and racial violence victims, as it’s better known — in Montgomery, Ala.
Murphy and his team took the current dimensions of the House and halls, shown in this image, as a starting point.

The chamber now comfortably accommodates about 450 people on the floor, along with more than 400 in the gallery on the second level.

The team’s first idea was to create a new elevated section that could easily allow seating for up to 904 members.

Sunday, April 2, 2023

Options for Enlarging the House

At WP, Danielle Allen writes that we need smaller House districts.
But how big should the House be? That is also to ask how small should a district be. And based on what math? And on what principle of growth?

Scholars and advocates have been working on this question for decades. There are seven basic options, all compiled in a report on enlarging the House by the American Academy of Arts and Sciences commission on the state of our democracy, which I co-chaired. Those options would increase the size of Congress from 435 to between 572 to 9,400. They are as follows:

The Wyoming Rule. Peg the size of a district to the population of the least-populous state, which is currently Wyoming (with about 580,000 people). That’s 180,000 fewer constituents than today’s average of 762,000 — and would yield a House of 572 members. The difficulty with this rule, though, is that it could cause the number of members to fluctuate dramatically depending on the growth patterns of the smallest states. One way to address that would be to pick the current number (580,000) as a stable ratio going forward. But that would lead to speedy growth in the size of the House over time.

The Deferred Maintenance Rule. When the size of the House was capped in 1929, new seats could shift to growing areas only by taking them away from other areas. The number of seats lost by particular states since 1929 through this method is 149. If we restored those seats and added one more to keep the total an odd number, then reallocated to achieve even districts, we would have a new base of 585 seats. This method is clean and yields districts slightly smaller than the current population of Wyoming. However, we would still need to figure out a principle of growth under this method. Would we take district sizes after such a reform as the standard ratio, and simply let the House grow in relation to it? This, too, would result in relatively fast growth.
The Cube Root Law. This method was developed to ensure that growth is slow and steady. Instead of picking a fixed number of House seats and establishing it as the target ratio for constituents to representatives, we would use the cube root of the national population to establish the number of legislators, then apportion across the states in proportion to state populations. Whenever the national population grows, so too would the number of representatives, but slowly compared with the other options. At our current population, this rule would give us 692 seats.

Here is a chart laying out the number of representatives you would have over time on three different growth principles, given population increases:

Thursday, March 30, 2023

California Is Losing Affluent Residents


Hans Johnson and Eric McGhee at PPIC:
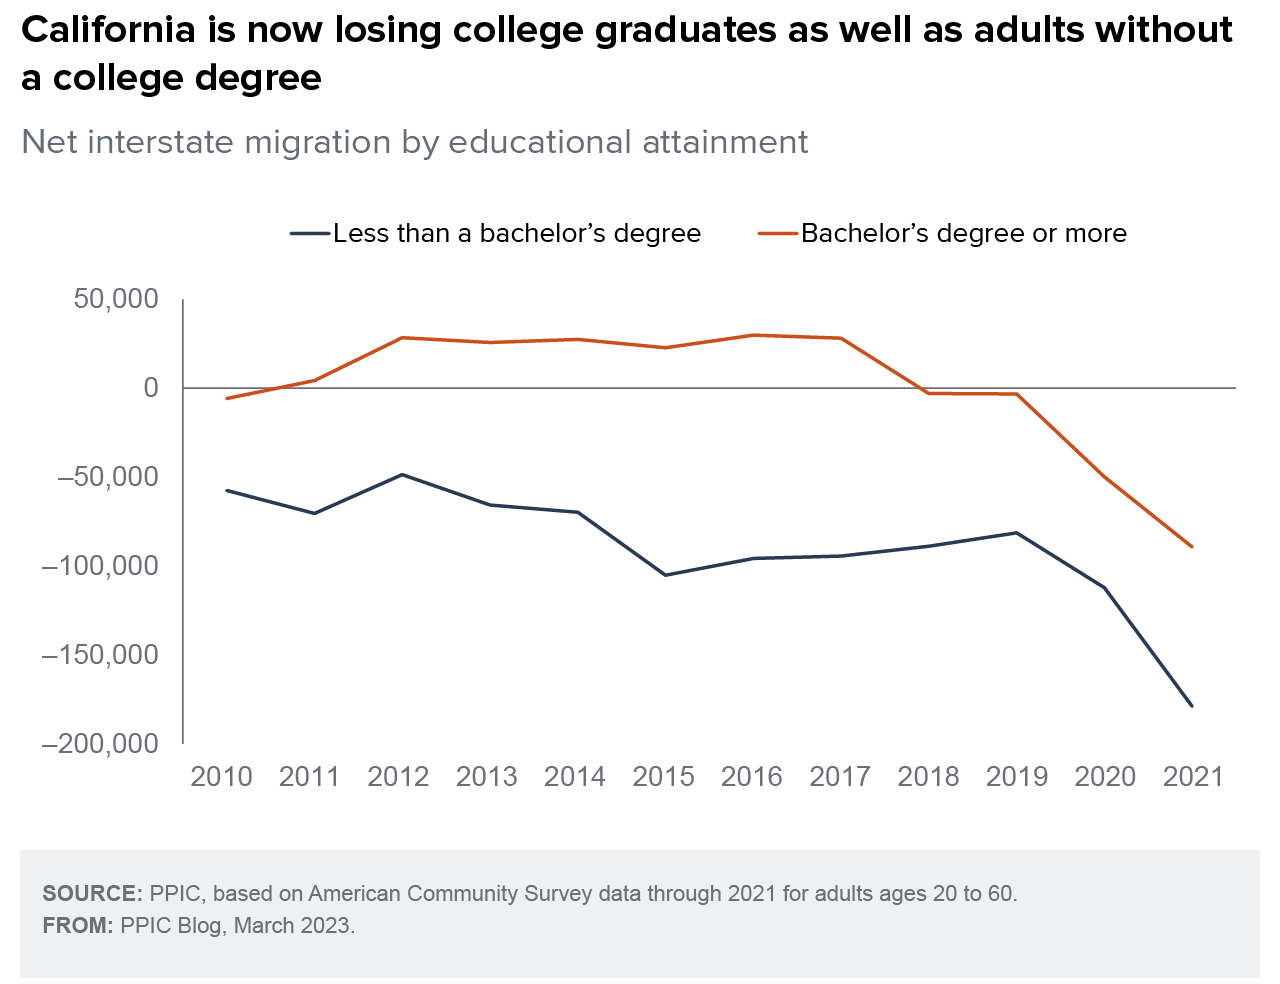
During the height of the pandemic, the flows out of the state became so large that almost every demographic and socioeconomic group has experienced net losses. For example, California used to gain college graduates even as it lost less educated adults. But in the last couple of years, the state has started losing college graduates as well, quite markedly—albeit still not to the same extent as less educated adults. Even among young college graduates in their 20s, a group that California has disproportionately attracted in the past, the flows out of the state have been about the same as the flows into the state.

figure - California is now losing college graduates as well as adults without a college degree

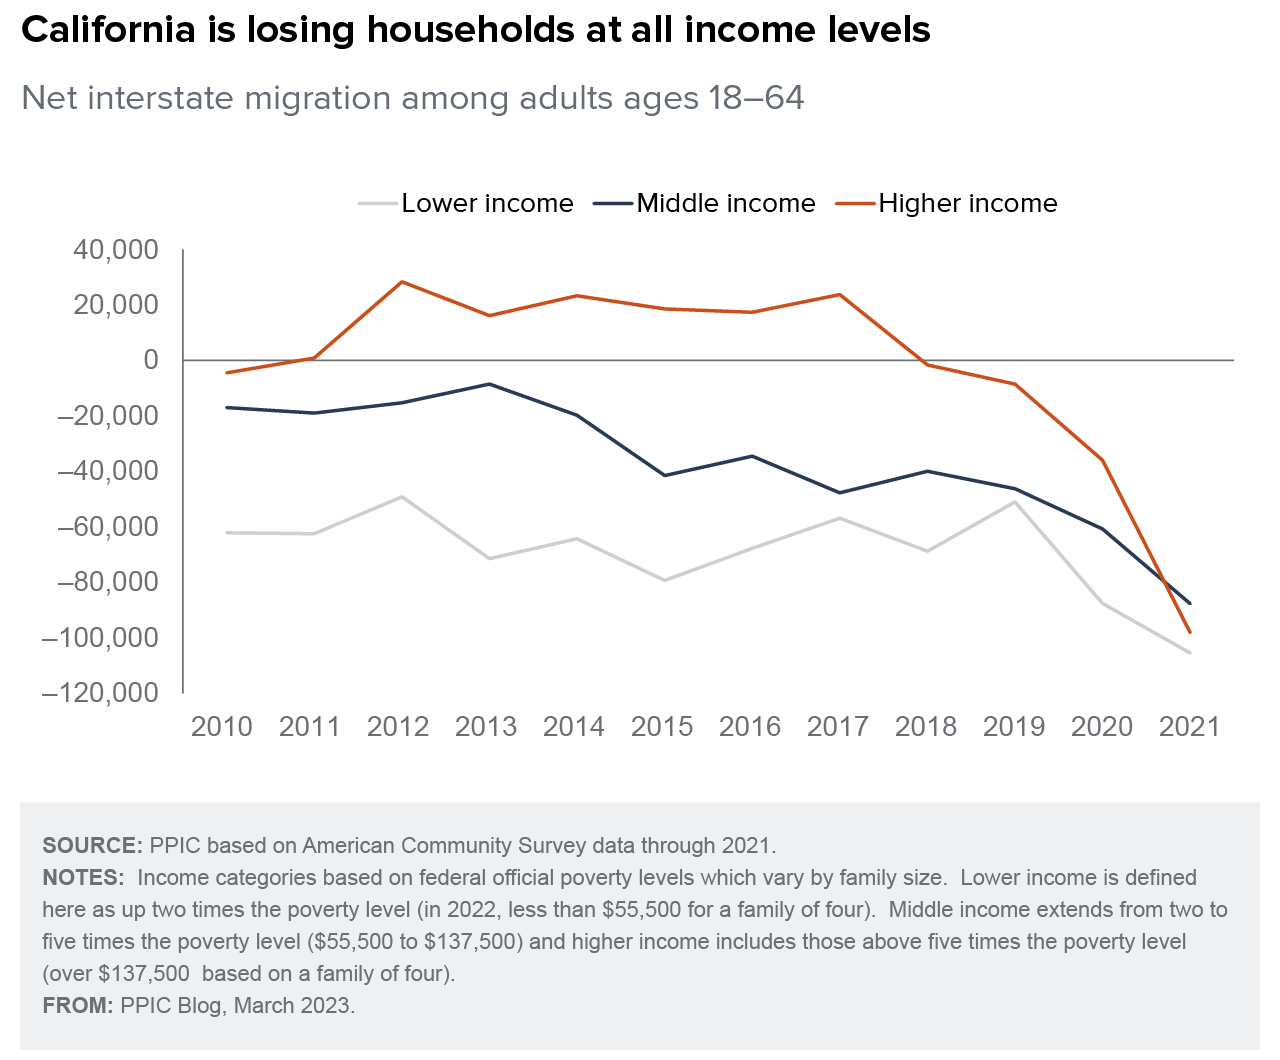
Perhaps most striking, California is now losing higher-income households as well as middle- and lower-income households. During the pandemic, the number of higher-income households moving to California declined a bit, but the number leaving the state increased dramatically (from less than 150,000 in 2019 to almost 220,000 by 2021).

figure - California is losing households at all income levels

The losses of college graduates and higher-income households are likely related to the ability of many highly educated and highly paid workers to work from home. The Census Bureau’s Household Pulse surveys show that about two-thirds of the almost three million Californians who telework full-time (five or more days per week) have at least a bachelor’s degree. Among recent higher-income Californians leaving the state, over half (53%) report working from home.

Wednesday, February 22, 2023

Shrinkage in California

Ben Christopher at CalMatter:
In 2021, it was big news — the “California exodus.” Now, it just looks like the new trend: California’s population is still shrinking.

According to the latest population estimates from the U.S. Census Bureau, California’s total population declined by more than 500,000 between April 2020 and July 2022.

Put another way, 1 out of 100 people living in California at the beginning of the COVID-19 pandemic had, two years later, left the state — either by U-Haul or by hearse.

Where’d they all go? 
  • Some died, though there were far more births;
  • Some left the country, though on net, more immigrants arrived;
  • The major driving factor: Californians departing for other states.
Just counting out-of-staters coming in and Californians leaving, the state’s population saw a 871,127 net decline. If you’re wondering why the state lost a congressional seat at the beginning of this decade, this is why.

This isn’t a national problem. It’s a California, New York, Illinois and Louisiana problem. California is one of only 18 states that saw its numbers decline and had the fourth biggest drop as a share of its population.

Monday, December 26, 2022

USA Grows, California and Illinois Shrink

From the Census Bureau:
After a historically low rate of change between 2020 and 2021, the U.S. resident population increased by 0.4%, or 1,256,003, to 333,287,557 in 2022, according to the U.S. Census Bureau’s Vintage 2022 national and state population estimates and components of change released today.

Net international migration — the number of people moving in and out of the country — added 1,010,923 people between 2021 and 2022 and was the primary driver of growth. This represents 168.8% growth over 2021 totals of 376,029 – an indication that migration patterns are returning to pre-pandemic levels. Positive natural change (births minus deaths) increased the population by 245,080.

“There was a sizeable uptick in population growth last year compared to the prior year’s historically low increase,” said Kristie Wilder, a demographer in the Population Division at the Census Bureau. “A rebound in net international migration, coupled with the largest year-over-year increase in total births since 2007, is behind this increase.”
...
Increasing by 470,708 people since July 2021, Texas was the largest-gaining state in the nation, reaching a total population of 30,029,572. By crossing the 30-million-population threshold this past year, Texas joins California as the only states with a resident population above 30 million. Growth in Texas last year was fueled by gains from all three components: net domestic migration (230,961), net international migration (118,614), and natural increase (118,159).

Florida was the fastest-growing state in 2022, with an annual population increase of 1.9%, resulting in a total resident population of 22,244,823.

“While Florida has often been among the largest-gaining states,” Wilder noted, “this was the first time since 1957 that Florida has been the state with the largest percent increase in population.”

It was also the second largest-gaining state behind Texas, with an increase of 416,754 residents. Net migration was the largest contributing component of change to Florida’s growth, adding 444,484 residents. New York had the largest annual numeric and percent population decline, decreasing by 180,341 (-0.9%). Net domestic migration (-299,557) was the largest contributing component to the state’s population decline.

Eighteen states experienced a population decline in 2022, compared to 15 and DC the prior year. California, with a population of 39,029,342, and Illinois, with a population of 12,582,032, also had six-figure decreases in resident population. Both states’ declining populations were largely due to net domestic outmigration, totaling 343,230 and 141,656, respectively.

Thursday, March 31, 2022

Shrinkage: Natural Decrease in Population

From the Census:
More than 73% (2,297) of U.S. counties experienced natural decrease in 2021, up from 45.5% in 2019 and 55.5% in 2020, according to the U.S. Census Bureau’s Vintage 2021 estimates of population and components of change released today. Natural decrease occurs when there are more deaths than births in a population over a given time period. In 2021, fewer births, an aging population and increased mortality – intensified by the COVID-19 pandemic--contributed to a rise in natural decrease. The statistics released today include population estimates and components of change for the nation’s 384 metropolitan statistical areas, 543 micropolitan statistical areas and 3,143 counties.

In 2021, all counties in Delaware, Maine, New Hampshire and Rhode Island experienced natural decrease. Some counties also experienced population declines attributable to migration. Counties with net international migration loss (more people moving out of than into the country), were most frequently found in California (41.4%), Oregon (27.8%) and Mississippi (23.2%). States with the highest percentages of counties with net domestic migration loss (people moving from one area to another within the United States) were Alaska (80.0%), Louisiana (71.9%) and Illinois (65.7%).

Most of the nation’s counties – 2,063 or 65.6% -- experienced positive domestic migration overall from 2020 to 2021. Arizona’s Maricopa County gained the most (46,866) residents from domestic migration, followed by Riverside County, California (31,251), and Collin County, Texas (30,191). Los Angeles County, California, experienced the greatest net domestic migration loss (179,757 residents), followed by New York County, New York (113,642).

Wednesday, December 22, 2021

Slowest Population Growth Since the Founding

From the Census Bureau:
According to the U.S. Census Bureau’s Vintage 2021 national and state population estimates and components of change released today, the population of the United States grew in the past year by 392,665, or 0.1%, the lowest rate since the nation’s founding. The slow rate of growth can be attributed to decreased net international migration, decreased fertility, and increased mortality due in part to the COVID-19 pandemic.

“Population growth has been slowing for years because of lower birth rates and decreasing net international migration, all while mortality rates are rising due to the aging of the nation’s population,” said Kristie Wilder, a demographer in the Population Division at the Census Bureau. “Now, with the impact of the COVID-19 pandemic, this combination has resulted in a historically slow pace of growth.”

Since April 1, 2020 (Census Day), the nation’s population increased from 331,449,281 to 331,893,745, a gain of 444,464, or 0.13%.

Between July 1, 2020, and July 1, 2021, the nation’s growth was due to natural increase (148,043), which is the number of excess births over deaths, and net international migration (244,622). This is the first time that net international migration (the difference between the number of people moving into the country and out of the country) has exceeded natural increase for a given year.

The voting-age resident population, adults age 18 and over, grew to 258.3 million, comprising 77.8% of the population in 2021.

The South, with a population of 127,225,329, was the most populous of the four regions (encompassing 38.3% of the total national population) and was the only region that had positive net domestic migration of 657,682 (the movement of people from one area to another within the United States) between 2020 and 2021. The Northeast region, the least populous of the four regions with a population of 57,159,838 in 2021, experienced a population decrease of -365,795 residents due to natural decrease (-31,052) and negative net domestic migration (-389,638).

The West saw a gain in population (35,868) despite losing residents via negative net domestic migration (-144,941). Growth in the West was due to natural increase (143,082) and positive net international migration (38,347).

Between 2020 and 2021, 33 states saw population increases and 17 states and the District of Columbia lost population, 11 of which had losses of over 10,000 people. This is a historically large number of states to lose population in year.

Also released today were national- and state-level estimates of the components of population change, which include tables on births, deaths and migration.

Thursday, December 9, 2021

Black Population Outflow from Big Cities

Shia Kappos and colleagues at Politico:
Chicago — and neighborhoods like Englewood — offer perhaps the most extreme example of a demographic upheaval reshaping power in cities across the country. The 2020 census shows Black Americans moving, in huge numbers, out of their longtime homes in Northern and Western cities, and resettling in smaller cities, the suburbs and — in a twist on the Great Migration of the 20th century — the South. Nine of 10 of the cities with the largest numbers of African Americans saw significant declines in their Black populations over the past 20 years, according to census data compiled by POLITICO.

In sheer numbers, Chicago’s outflow has been particularly dramatic. In 1980, about 40 percent of the city’s total population was Black — one of the country’s most formidable concentrations of Black business and political power. Since then, that number has dropped to just under 29 percent. Only Detroit, a city with its share of troubles, has seen a bigger drop in Black residents.