Search This Blog

Showing posts with label marriage. Show all posts

Tuesday, February 24, 2026

LGBTQ Estimates and Opinion


Jeffrey M. Jones at Gallup:
The Data: Nine percent of U.S. adults in 2025 said they identify as lesbian, gay, bisexual, transgender or something other than heterosexual, essentially unchanged from 2024 but more than double the 3.5% measured in 2012. The 2025 estimate is based on combined data from over 13,000 interviews with U.S. adults.

Identity Distribution: Eighty-six percent of adults identify as heterosexual, while 5% do not provide a response. Among LGBTQ+ adults, more than half identify as bisexual, representing about 5% of all U.S. adults. Seventeen percent of LGBTQ+ adults identify as gay, 16% as lesbian and 12% as transgender, each accounting for between 1% and 2% of the U.S. adult population.


Monday, February 3, 2025

Diploma Divide and Marriage

 Many posts have discussed economic and educational inequality. The effects of inequality reach many corners of American life.


Chambers, Clara and Goldman, Benjamin and Winkelmann, Joseph, Bachelors Without Bachelor's: Gender Gaps in Education and Declining Marriage Rates (January 01, 2025). Available at SSRN: https://ssrn.com/abstract=5086363 or http://dx.doi.org/10.2139/ssrn.5086363. Abstract:

Over the past half-century, the share of men enrolled in college has steadily declined relative to women. Today, 1.6 million more women than men attend four-year colleges in the U.S. This trend has not lowered marriage rates for college women, a substantial share of whom have historically married economically stable men without college degrees. Both historical evidence and cross-area comparisons suggest that worsening male outcomes primarily undermine the marriage prospects of non-college women. The gap in marriage rates between college-and non-college women is more than 50% smaller in areas where men have the lowest rates of joblessness and incarceration.


Tuesday, December 24, 2024

Kinless at Christmas


Alysse ElHage and Brad Wilcox at Deseret News:
In fact, starting in the past decade, the share of “kinless” prime-aged (18-55) adults — defined here as those who are never married and have no children in the home — exceeded the share of Americans who are married with children for the first time in our nation’s history.
This trend is an indication of what we have called “the closing of the American heart,” as fewer young adults take the plunge, get married and start a family. Among the many reasons for the decline in marriage is that more and more young men and women are prioritizing a “Midas Mindset” over a “Marriage Mindset” — that is, focusing on education and work like Taylor did, rather than on love and marriage. Consequently, a growing share of young women and men are slated to never marry. In fact, demographers project that a staggering share of today’s young adults — one in three — will never marry, as the Institute for Family Studies reported.
This decline in marriage is linked to the growing share of Americans who do not have children: in fact, more than 1 in 5 American 50-something adults have never had kids, according to Pew Research Center. Moreover, the share of younger Americans who don’t think they will ever be parents is growing. As Pew reports, “the share of U.S. adults younger than 50 without children who say they are unlikely to ever have kids rose 10 percentage points between 2018 and 2023 (from 37% to 47%).”

Demographer Lyman Stone projects that a record share of today’s young adults will never have children — probably about 1 in 4 men and women in their twenties now will go through life without ever having children.

The repercussions of a kinless future for more American adults extend far beyond a lonely holiday season for the growing share of women and men who have no immediate kin. As the family falls, loneliness rises, deaths of despair surge and the “pursuit of happiness” becomes more unattainable not just for individuals but communities across the nation. That’s because both marriage and parenthood are linked with increased mental and emotional well-being and better overall physical health for both men and women. And while many people today wrongly believe that a satisfying career and a good income are the keys to happiness, the No. 1 predictor of overall life satisfaction is how satisfied people are in their marriage. In fact, as “Get Married” notes, men and women who are happy in their marriages are 545% more likely to be happy in their lives than those who are unhappily married or those who are unmarried.


Sunday, September 29, 2024

Gender Differences

 Mike Allen at Axios:

A flood of data reveals a little-discussed, future-defining trend: Men and women are going separate ways.The split is clear in politics, religion, education and the labor market, Axios' Erica Pandey reports.

Why it matters: For the next generation, gender is becoming the biggest predictor of how you think, act and vote.

"There's a much broader story here," says Daniel Cox, director of the Survey Center on American Life. "Even after all the votes are tallied and we've moved on from the 2024 election, we're not going to have resolved any of the cultural and relational tension between young men and young women."
  • "You see it in politics: Women are turning left. Men are turning right.
  • You see it in religion: For the first time ever recorded in the U.S., young men are more religious than young women.
  • You see it in education: There are 2.4 million more women on U.S. college campuses than men, the American Institute for Boys and Men (AIBM) notes. Those degrees are often resulting in higher-wage jobs for women in big cities.
  • You see it in the labor market: Wages and labor force participation have increased since the 1980s for college-educated men and women, and for working-class women. But they have stagnated for working-class men, who are also now significantly less likely to be employed than four decades ago, according to AIBM's analysis.
  • You see it in visions for the future: Men are more likely than women to want marriage and kids, according to Pew Research Center.

Friday, July 26, 2024

Reasons for Not Having Children

Many posts have discussed demographic trends, especially the decline of births and the aging of the population.

Rachel Minkin et al. at Pew:

The U.S. fertility rate reached a historic low in 2023, with a growing share of women ages 25 to 44 having never given birth.

And the share of U.S. adults younger than 50 without children who say they are unlikely to ever have kids rose 10 percentage points between 2018 and 2023 (from 37% to 47%), according to a Pew Research Center survey.

In this report, we explore the experiences of two groups of U.S. adults: 
  • Those ages 50 and older who don’t have children
  • Those younger than 50 who don’t have children and say they are unlikely to in the future
About four-in-ten of those in the older group (38%) say there was a time when they wanted to have children. A smaller but sizable share (32%) say they never wanted children, and 25% say they weren’t sure one way or the other. Few say they frequently felt pressure to have children from family, friends or society in general. 


Saturday, July 13, 2024

Party and Marriage


Jonathan Rothwell and Frank Newport at Gallup:
For 40 years during the middle of the 20th century, Gallup recorded little difference in the marriage rates of middle-aged Republicans and Democrats -- those of the prime marriage ages of 30-50. [2] But a gap emerged in the 1980s as the rate fell rapidly for Democrats but much less so for Republicans. It widened further in the 1990s and 2000s before narrowing a bit since the 2010s as Republicans’ marital rate fell closer to the Democrats’ rate. The latest data suggest the gap may be widening again.

Long term, the marriage rate for Democrats aged 30-50 fell from as high as 90% at points in the 1950s and 1970s to below 60% after 1990 and just under 50% in 2021 and 2024 to date. And the pattern among independents has been similar. Over the same period, Republicans’ marriage rate fell from a peak of 90% in 1965 to less than 80% since 1990 and stands at 67% in 2024 to date.

From 2000 to the present, the Republican marriage rate has averaged 18 percentage points above the Democratic marriage rate. The trend for independents, meanwhile, has been close to that of Democrats.

...

 Party identification is strongly correlated with a number of demographic characteristics. But statistical analysis simultaneously taking multiple variables into account shows that a gap between Republicans’ and Democrats’ marriage rates persists even after adjusting for age, gender, education, and race or ethnicity. Since 1980, the partisan marriage gap has been 19 points among adults 30 to 50. Adjusting for the factors listed above, the gap shrinks only modestly, to 16 points.


Tuesday, January 9, 2024

Dynamics of Families after Nonmarital Birth

 Dynamics of Families After a Nonmarital Birth

By Angela Rachidi

American Enterprise Institute

January 08, 2024

Abstract

Despite known links between poverty rates and unmarried parenthood, we know little about how changes in family situations after a nonmarital birth affect poverty. This study explores Future of Families and Child Wellbeing Study data to document changes to the relationship status, employment status, and education level of a cohort of unmarried mothers who gave birth in urban areas in the late 1990s and the implications for poverty rates over a 15-year follow-up period. For children born to unmarried parents in urban areas, official poverty rates improved modestly in the 15 years after the birth, with maternal employment, education gains, and marriage corresponding to lower poverty rates on average over time. Using the success sequence as a framework, poverty rates were dramatically (and statistically) lower when mothers who were unmarried at the time of childbirth subsequently married, worked full-time, and had at least a high school education, suggesting the achievement of success-sequence milestones can lead to lower child poverty even after the birth of a child outside marriage

Sunday, August 13, 2023

Why Are Young People Leaving Religion


Daniel Cox, at The Survey Center on American Life:
The question remains: what is the reason so many young people are leaving religion? There’s no single answer, but the most compelling explanation is that changes in American family life precipitated this national decline. American families have changed dramatically over the past few decades and many churches have been slow to respond. Americans raised in blended families, interfaith families or single-parent families are far less likely to have participated in religion growing up. And these types of family arrangements have become far more common today than they once were. The family explanation is compelling for a few reasons: 
  1. Young people today are leaving much earlier than those of previous generations. Seventy percent of young adults who have disaffiliated shed their formative religious identities during their teen years.
  2. The Americans most likely to “leave” religion are those with the weakest formative attachments. Compared to previous generations, Generation Z reports having a less robust religious experience during their childhood.
  3. Most Americans who disaffiliate say they “drifted away” from religion rather than experiencing a singular negative or traumatic event that pushed them out. To put it another way, they quiet quit.
  4. A wealth of research has shown that religious socialization in the family is a key component of the transmission of religious values, identity, and beliefs across generations.

Tuesday, April 25, 2023

Ethnicity and Married Birth Parents

 Data Tools 6. The Geography of Traditional Families in America Charles Murray American Enterprise Institute April 2023

The ethnic differences in the prevalence of traditional marriage are huge. Among the nearly five million children in the ACS from 2014 to 2021, these were the percentages of children living with married birth parents broken down by the child’s ethnicity: 

Child’s Ethnicity Married Birth Parents 

Asian ............................82% 

White ............................62%

 Other or Mixed ,,,,,,,,,,,,50% 

Latino ,,,,,,,,,,,,,,,,,,,,,,,,,,,,43%

 Black ............................23% 

Asian children and black children effectively live in different familial worlds. The difference in living situations between white and black children is less dramatic but still extremely large.

Saturday, February 25, 2023

Marriage Rates

Many posts have discussed marriage and family.

Erica Pandey at Axios:
Americans are increasingly forgoing or delaying marriage — a dramatic shift from societal norms a generation ago.

By the numbers: Over the last 50 years, the marriage rate in the U.S. has dropped by nearly 60%.

What's happening: Taxes and some other legal structures still give an advantage to married couples, but the formal benefits of marriage are diminishing, said Andrew Cherlin, a sociologist at Johns Hopkins. And the societal pressure to marry has eroded dramatically. "Life is still a bit easier if you're married," he said. But many of the life events we link to marriage, such as cohabitating or having kids, are increasingly occurring outside of marriage.

Reality check: Even as the marriage rate is falling, the institution still holds value in the U.S., said Susan Brown, co-director of the National Center for Family & Marriage Research.Case in point: High school seniors' attitudes toward marriage have remained relatively stable over the past several decades.
In 1976, 74% of seniors said they expected to get married, and in 2020, 71% said so, according to an ongoing University of Michigan study.

Tuesday, January 17, 2023

Unmarried Voters

 Karlyn Bowman, Ruy Teixeira, and Nate Moore at AEI:

Understanding the unmarried share of the electorate will be increasingly important in coming years. Married voters are still a significantly larger share of the electorate than unmarried ones. But young people are marrying later, if at all. In 2021, according to General Social Survey data, only 15 percent of 18–29-year-old women were married, half of what it was in 2000. The young today are more ethnically diverse, less conventionally religious, and more Democratic or independent than previous generations.

Two trends confirm the liberalism of young women today. An Astin study of entering college freshmen found that in 2016, before the Me Too movement exploded, 41 percent of the women self-identified as liberal or far left, but only 28.9 percent of the young men did. Between 1966, when this survey began, and 1980, men were more liberal. The gap shrank during the Reagan administration, and since the late 1980s, women have been more liberal/left than men in their first year of college. Our AEI colleague Dan Cox showed a similar pattern using Gallup data from 1998 through 2021, with 44 percent of young women describing themselves as liberal in 2021 compared to 25 percent of young men. Additionally, as the August American Perspectives Survey shows, the Dobbs decision appears to be a significant generational moment for young women, who saw the decision as more ominous than their male counterparts. If young women carry these attitudes with them as they age, Democrats will reap the rewards.

Friday, December 16, 2022

Religion and Class

Daniel Cox:

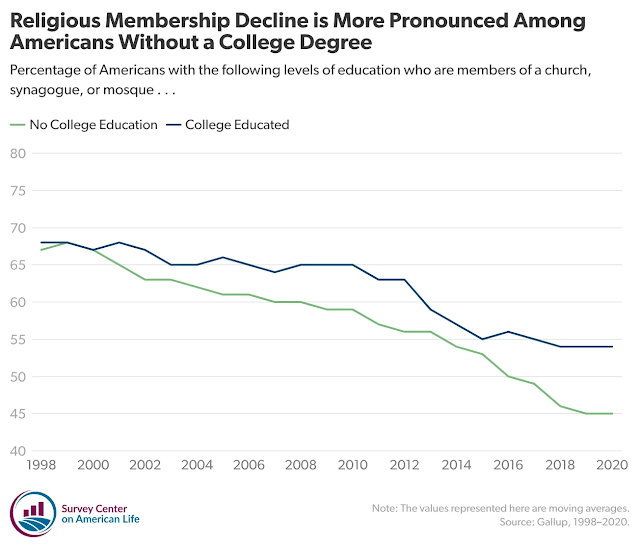
It has long been presumed, and in some cases feared, that higher education—and the widespread availability of information and knowledge via the Internet—would undermine religious commitments. Actual evidence for this is lacking. While religious doubting has grown in recent years, the most educated Americans show up to services most often. Even as they report less certainty in their religious beliefs, they participate more regularly in worship services. Higher education appears to reinforce regular religious participation.
...
The simplest explanation is that college-educated Americans are more likely to prioritize religious participation and to pass these experiences on to their children. ... The growing class gap in religious attendance is partially attributable to plummeting marriage rates in non-college households. Three decades earlier there was only a modest gap in marriage rates between Americans with a college degree and those without. The gap has since tripled in size and continues to grow. For a number of reasons, married people tend to be more religiously active, whether it’s due to having greater personal and financial resources, more social stability, or firmer desire to raise children in a religious community.
...

One thing that seems clear is that the decline of churches will likely make inequality worse. College-educated Americans are more active and involved in every sphere of American social and civic life, from book clubs and PTA meetings, to sports leagues and town halls. On average, they have more friends, broader social networks, and more extensive ties to the places where they live. If you want a fuller accounting of the abundant ways college graduates reap these social capital benefits, check out this recent report: “The College Connection: The Education Divide in American Social and Community Life.” Churches offer one way to bridge the gap, but fewer Americans are turning to them.


Sunday, November 27, 2022

Alone

 Dana Goldstein and Robert Gebeloff at NYT:
In 1960, just 13 percent of American households had a single occupant. But that figure has risen steadily, and today it is approaching 30 percent. For households headed by someone 50 or older, that figure is 36 percent.

Nearly 26 million Americans 50 or older now live alone, up from 15 million in 2000. Older people have always been more likely than others to live by themselves, and now that age group — baby boomers and Gen Xers — makes up a bigger share of the population than at any time in the nation’s history.

The trend has also been driven by deep changes in attitudes surrounding gender and marriage. People 50-plus today are more likely than earlier generations to be divorced, separated or never married.
...
But while many people in their 50s and 60s thrive living solo, research is unequivocal that people aging alone experience worse physical and mental health outcomes and shorter life spans.
...
Compounding the challenge of living solo, a growing share of older adults — about 1 in 6 Americans 55 and older — do not have children, raising questions about how elder care will be managed in the coming decades.

Bryce Ward at WP:

According to the Census Bureau’s American Time Use Survey, the amount of time the average American spent with friends was stable, at 6½ hours per week, between 2010 and 2013. Then, in 2014, time spent with friends began to decline.
By 2019, the average American was spending only four hours per week with friends (a sharp, 37 percent decline from five years before). Social media, political polarization and new technologies all played a role in the drop. (It is notable that market penetration for smartphones crossed 50 percent in 2014.)

Covid then deepened this trend. During the pandemic, time with friends fell further — in 2021, the average American spent only two hours and 45 minutes a week with close friends (a 58 percent decline relative to 2010-2013).

Similar declines can be seen even when the definition of “friends” is expanded to include neighbors, co-workers and clients. The average American spent 15 hours per week with this broader group of friends a decade ago, 12 hours per week in 2019 and only 10 hours a week in 2021.


Sunday, June 26, 2022

Fathers

At AEI, W. Bradford Wilcox and colleagues write:
The decline of marriage and the rise of fatherlessness in America remain at the center of some of the biggest problems facing the nation: crime and violence, school failure, deaths of despair, and children in poverty.

The predicament of the American male is of particular importance here. The percentage of boys living apart from their biological father has almost doubled since 1960—from about 17% to 32% today; now, an estimated 12 million boys are growing up in families without their biological father.1 Specifically, approximately 62.5% of boys under 18 are living in an intact-biological family, 1.7% are living in a step-family with their biological father and step- or adoptive mother, 4.2% are living with their single, biological father, and 31.5% are living in a home without their biological father.2

Lacking the day-to-day involvement, guidance, and positive example of their father in the home, and the financial advantages associated with having him in the household, these boys are more likely to act up, lash out, flounder in school, and fail at work as they move into adolescence and adulthood. Even though not all fathers play a positive role in their children’s lives, on average, boys benefit from having a present and involved father.


 1. Numbers are calculated based on the 2019 American Community Survey, and Lydia R. Anderson, Paul F. Hemez, and Rose M. Kreider, “Living Arrangements of Children: 2019,” Current Population Reports, P70-174, U.S. Census Bureau, Washington, DC, 2021.

2. Ibid.


Saturday, March 26, 2022

Gen Z and the Future of Faith


At the Survey Center on American Life, Daniel A. Cox has a report titled  "Generation Z and the future of faith in America,"
Key Points
Compared with previous generations, Gen Zers report being much less involved in regular religious activities during their childhood. Formative religious experiences that were once common, such as saying grace or attending Sunday school, have become more of the exception than the norm.
In a change from the past, most Americans raised without religion do not find it later in life. Today, nearly two-thirds (65 percent) of Americans who report having no childhood religious affiliation say they still are unaffiliated as adults, rivaling that of established religious traditions.
Religious disaffiliation can strain family relationships and may lead to feelings of loneliness and distrust, especially for those who have left more conservative religious traditions, such as evangelical Protestantism.

Read the PDF.

The story of religious change in America, especially religious disaffiliation, is often cast as the result of independent decisions made by a rising generation living by a different set of values.But new evidence paints a much more complicated picture than the traditional narrative of generationally driven disaffiliation. Young adults today have had entirely different religious and social experiences than previous generations did. The parents of millennials and Generation Z did less to encourage regular participation in formal worship services and model religious behaviors in their children than had previous generations. Many childhood religious activities that were once common, such as saying grace, have become more of the exception than the norm.

We have long known the importance of formative religious experiences in setting the trajectory of faith commitments throughout life. For as long as we have been able to measure religious commitments, childhood religious experiences have strongly predicted adult religiosity. They still do. If someone had robust religious experiences growing up, they are likely to maintain those beliefs and practices into adulthood. Without robust religious experiences to draw on, Americans feel less connected to the traditions and beliefs of their parents’ faith.

There is little evidence to suggest that Americans who have disaffiliated will ever return. First, the age at which Americans choose to give up their families’ religion—most well before they turn 18—suggests that they have not established a deeply rooted commitment to a set of religious beliefs and practices. Disaffiliated Americans express significant skepticism about the societal benefits of religion, even more than those who have never identified with a religious tradition. They also strongly disagree with the majority of religious Americans, who believe in the importance of raising children in a religious faith. Moreover, having children does not appear to affect religious involvement. Unaffiliated parents are not any more likely to be religiously active than those without children, and most are unconvinced that religion serves as an important source of moral instruction.

Religious participation has typically been tightly connected to the timeline of important life events, such as getting married and having children. These events and experiences can serve as crucial opportunities for those who have left their childhood faith to reconnect to a religious community. But declining confidence in organized religion and a growing trend of secular relationships and marriages may make these seminal moments less likely to encourage Americans to return.

These changes have considerable personal and societal consequences. Individually, Americans who report leaving their formative religion report more significant personal hardship than those who were raised—and remain—religious. This is particularly true for Americans who disaffiliate from more conservative religious traditions; 39 percent of Americans raised evangelical Protestant but who no longer identify with the religion say they feel lonely or isolated from the people around them most or all the time. In contrast, only 23 percent of former Catholics say the same.

The decline of religion has implications for American civic and social life as well. Religious Americans are generally more socially and civically active. However, the frequency of religious participation—not one’s religious identity—appears to be the most important factor in determining the level of engagement in other social and civic activities. Americans who regularly attend services are far more engaged in community life than are those who seldom or never attend religious services.

And although higher education has been shown to be strongly associated with an increased propensity toward joining social groups and civic associations, religion still appears to play a significant function. There is evidence that education level and religious involvement both augment participation in community life. College-educated Americans who are religious tend to exhibit the highest levels of civic engagement.

Friday, February 11, 2022

Attitudes Toward Marriage and Society

Daniel A. Cox at the Survey Center on American Life:
Although most Americans have a positive view about marriage, there is considerable skepticism about the societal benefits that marriage and parenthood confer. Overall, roughly six in 10 (62 percent) Americans believe society is just as well off if people have priorities other than getting married and having children. Thirty-seven percent say society benefits when people make marriage and child-rearing priorities.

Younger Americans are least likely to see the societal value in marriage and parenthood. Forty-four percent of seniors (age 65 or older) say a society that prioritizes marriage and child-rearing is better off, while only one-quarter (25 percent) of young adults (age 18 to 29) say the same. Roughly three-quarters (74 percent) of young adults believe society is just as well off if people have other goals.

The generation gap is even larger among men. Senior men are about twice as likely as young men to say that society is better off when marriage and child-rearing are priorities (51 percent vs. 26 percent).

Liberals and conservatives are sharply at odds over the societal importance of family formation. A majority (57 percent) of conservatives believe society is better off when marriage and child-rearing are priorities, a view shared by only 19 percent of liberals.

The generational shift in attitudes cuts across ideology but is far larger among conservatives. Older liberals are somewhat more likely than young liberals to embrace the notion that society benefits when getting married and having children are priorities (23 percent vs. 15 percent). Large majorities of both age groups reject this idea. In contrast, older conservatives are far more likely than young conservatives to believe in the societal benefit of people prioritizing marriage and children (64 percent vs. 37 percent).


Wednesday, February 9, 2022

Politically Mixed Marriages

Daniel A. Cox at the Survey Center on American Life:
While interfaith marriages in the United States are on the rise, politically mixed marriages remain uncommon. One in five (20 percent) Americans have a spouse whose political affiliation differs from their own.[11] The vast majority (80 percent) of Americans are married to people who share their same basic political orientation.

The degree of political diversity in marriages is nearly identical among Democrats and Republicans. Only 17 percent of Democrats and 16 percent of Republicans report having a spouse who has a political identity different from their own. In contrast, about four in 10 (39 percent) political independents say their spouse has a political identity different from theirs.

Americans who identify as politically moderate are also more likely to have marriages that cross the political aisle. Moderates (28 percent) are twice as likely as both liberals (14 percent) and conservatives (14 percent) to report their spouse’s political identity is distinct.

Unlike interfaith marriages, which have become more common in recent years, the prevalence of politically mixed marriages is more stable. Thirteen percent of couples married before 1972 have dissimilar political affiliations, compared to 21 percent of those married in the past decade.

Having a spouse who does not share the same political orientation may lead to somewhat reduced feelings of relationship satisfaction. Republicans in mixed marriages are less likely to be very or completely satisfied in their relationship than are those married to people aligned with their politics (86 percent vs. 75 percent). There is a more pronounced gap in feeling completely satisfied. Republicans married to politically similar spouses are much more likely than those in politically mixed marriages to say they feel completely satisfied with their relationship (49 percent vs. 34 percent). Democrats married to someone who shares their politics also report greater relationship satisfaction; 74 percent of Democrats whose spouse has similar political views say they are very or completely satisfied, compared to 67 percent in politically mixed marriages.

Being in a politically mixed marriage is associated with having less extreme political views and partisan hostility. Two-thirds (66 percent) of Democrats with a Democratic spouse say they have a very unfavorable view of the Republican Party, compared to 34 percent of Democrats in mixed marriages. Similarly, three-quarters (73 percent) of Republicans in politically homogenous marriages say they have a very unfavorable view of the Democratic Party, while less than half (46 percent) of those who have a spouse who does not share the same politics have a very negative view of the Democratic Party.

Politically mixed marriages may also soften Republicans’ views of opposing party leadership. Republicans married to other Republicans express a much more negative opinion of Joe Biden than those whose spouses have somewhat different political views (82 percent vs. 54 percent, respectively). Notably, for Democrats, negative views of Donald Trump appear to transcend marital influence. Democrats in mixed marriages are not much less likely than those in politically aligned marriages to say they have a very unfavorable view of Trump (73 percent vs. 87 percent).

Tuesday, November 30, 2021

Living Arrangements

From the Census Bureau:
The percentage of adults living with a spouse decreased from 52% to 50% over the past decade, according to newly released estimates from the U.S. Census Bureau’s annual America’s Families and Living Arrangements table package.

At the same time, living alone became slightly more common: 37 million (15%) adults age 18 and over lived alone in early 2021, up from 33 million (14%) in 2011. The percentage of adults living with an unmarried partner also inched up over the past decade, from 7% to 8%.

These statistics come from the 2021 Current Population Survey’s Annual Social and Economic Supplement (ASEC), which collects labor force data as well as data on a variety of characteristics of households, living arrangements, married/unmarried couples and children. The ASEC has been conducted for more than 60 years and so allows for an examination of trends in families and living arrangements.

Other Highlights

Households and Families
  • There were 37 million one-person households in 2021, or 28% of all U.S. households. In 1960, single-person households represented only 13% of all households.
  • The number of families with their own children under age 18 in the household declined over the last two decades. In 2021, 40% of all U.S. families lived with their own children, compared to 44% in 2011 and 48% in 2001.
Marriage
  • In 2021, 34% of adults age 15 and over had never been married, up from 23% in 1950.
  • The estimated median age to marry for the first time was 30.4 for men and 28.6 for women in early 2021, up from ages 23.7 and 20.5, respectively, in 1947.
  • In 2021, less than one-quarter (24%) of children under age 15 living in married-couple families had a stay-at-home mother, compared to 1% with a stay-at-home father.
Living Arrangements
  • Some living arrangements differed by sex and age group in 2021. The percentage of men and women ages 18 to 24 that lived alone, about 5% each, did not significantly differ. More women than men in this age group lived with a spouse, 7% and 4%, respectively. The percentage of men ages 18 to 24 living alone was not significantly different from the percentage of men who lived with a spouse. A greater share of women (12%) than men (7%) this age also lived with an unmarried partner.
  • Men and women ages 25 to 34 were more likely than their younger peers to live with a spouse or unmarried partner: one-third (33%) of men and 42% of women lived with a spouse in early 2021. But about the same share (17%) of both men and women of these ages lived with an unmarried partner. These patterns were likely related to the lower median age of women (28.6) than men (30.4) at first marriage.
  • In 2021, more than one-half (58%) of adults ages 18 to 24 lived in their parental home, compared to 17% of adults ages 25 to 34.
For more data on families and living arrangements, visit Families and Living Arrangements at <www.census.gov>.

Friday, October 29, 2021

American Family Survey

Karlyn Bowman at Forbes:

The American Family Survey* is now in its seventh year. The poll is sponsored by the Deseret News and the Center for the Study of Elections and Democracy at Brigham Young University. YouGov fielded the online survey to 3,000 American adults. The researchers have asked many identical questions over the seven-year time span and added new ones each year to understand particular experiences of the modern family. In 2020, the polling team looked at family life during the first year of the pandemic. In the new 2021 survey, they took a deeper dive into how Americans are coping with the pandemic, their views of the government’s response to it, and Americans’ interactions across racial lines. They also looked at how Americans feel about the teaching of subjects such as racism and racial progress in schools.

We see substantial continuity across the yearly AFS surveys. People continue to say their own marriages and families are doing well. Yet, the survey hints at a slight softening in positive views about the institution. The percentage believing that marriage is needed to create strong families has dropped 10 points in seven years — from 62% in 2015 to 52% today. The number saying that marriage is old-fashioned and out of date has risen from 12% to 19%. Given these responses, it will be important to watch what people say in the future. Just as in each of the earlier surveys, this one shows people are less confident about marriage and families in general, but are more optimistic about their own.

The researchers note that racial and economic disadvantage predate the pandemic, but they still pointed to the significant hardship COVID created for some groups. More Hispanics, for example, reported a death in their immediate or extended family (21%) than did African Americans (16%) or Whites (9%). Forty percent of low-income families compared to 12% of high-income ones reported experiencing an economic crisis in the past year. Majorities of all income categories said their financial circumstances had not changed since March 2020, but 28% of low-income families compared to 14% of high-income families said their situations had gotten worse. Single-parent households have been hit especially hard with 27% reporting their finances have gotten worse during the pandemic.

Saturday, October 23, 2021

Polarized Attitudes on Family Formation

W Bradford Wilcox and colleagues at AEI have a report titled "The divided state of our unions
Where is the American family headed as COVID-19 finally seems o be abating? Focusing on family formation in the United States, this report considers three possibilities: (a) the “decadence-deepens scenario,” where marriage and fertility fall further in the wake of the pandemic; (b) the “renaissance scenario,” where men and women turn towards family formation in response to the existential questions and loneliness raised by the last year-and-a-half; and (c) the “family polarization scenario,” where economic, religious, and partisan divides in family formation deepen in post-COVID America.

Based on two new YouGov surveys by the Institute for Family Studies (IFS) and the Wheatley Institution, this report finds the most consistent evidence for the “family polarization scenario.” The “desire to marry” since the onset of COVID-19 ticked slightly upwards, by 2 percentage points overall, whereas the desire “to have a child” among all Americans ages 18-55 moved downwards, with just 10% reporting an increased desire for children, compared to 17% indicating a decreased desire. However, beyond these global shifts in family formation attitudes, which do not tell a consistent story in favor of either of the first two scenarios, there is marked polarization in desires related to marriage and childbearing by income, religious attendance, and partisanship as COVID-19 abates.

That’s because in a pandemic-haunted world where both marriage and fertility seem especially daunting or optional, three ingredients have emerged as signally important for family formation in the United States: money, hope, and a deep dedication to family. And the rich, the religious, and Republicans are generally more likely to possess one or more of these ingredients, compared to their lower-income, secular, and Democrat/Independent-affiliated fellow citizens. The family polarization documented here is especially striking because it augments fissures in American family life that have been growing over the last half century.