Search This Blog

Showing posts with label language. Show all posts

Friday, March 7, 2025

English as Official Language

Ballotpedia:

    As of 2025, 30 states had designated English as their official language. Three—Alaska, Hawaii, and South Dakota—also recognize some indigenous languages as co-official languages. Most (27) of these states adopted their official language between the 1980s and 2000s, with a median year of 1988.

    In 1991, Michele Arington wrote that "[a]lthough a proposed [federal] constitutional amendment, the 'English Language Amendment,' has stalled repeatedly in the Congress," supporters had "considerable success at the state and local levels." Arington added, "The preferred method of enacting such legislation, especially in recent years, has been the initiative and referendum."[1] The trend emerged in the 1980s with California Proposition 63 and continued into the 2000s, with the most recent vote taking place in 2010 in Oklahoma.

    Of the 30 states that designated English as their official language, 11 (37%) did so through voter-approved ballot measures. Measures were approved in Alabama, Alaska, California, Colorado, Florida, Hawaii, Missouri, Nebraska, Oklahoma, Utah, and twice in Arizona. The average vote on these measures was 73.1%, with support ranging from 50.5% to 88.5%.

    On March 1, 2025, President Donald Trump (R) issued an executive order "[designating] English as the official language of the United States."[2]


Thursday, September 12, 2024

HIspanics Do Not Like "Latinx"

Some academics use "Latinx."  They should not. Hispanics dislike it.

From Pew:
In the long-running debates about which terms to use to describe the U.S. population with roots in Latin America and Spain, “Latinx” has emerged as a gender-neutral alternative to Hispanic and Latino, the two most popular pan-ethnic terms used today.

After years of public use by celebrities, leaders, media, academics and others, awareness of Latinx has grown among U.S. Latinos.1 Nearly half (47%) say they have heard of Latinx, up from 23% who said the same in 2019. Notably, awareness of Latinx has grown across nearly all major demographic subgroups of U.S. Latinos.

Still, about half of the population that Latinx is meant to describe has never heard of the term.

While awareness of the term has grown, the share who use Latinx to describe themselves is statistically unchanged: 4% of Latino adults say they have used Latinx to describe themselves, little changed from the 3% who said the same in 2019.

Importantly, the 4% of Latino adults who say they have used Latinx to describe themselves amount to an estimated 1.9 million people.2

As awareness of Latinx has grown, its rise in use in some spaces has brought increased scrutiny in the United States and abroad.

In the U.S., a Latino civil rights organization dropped its use of Latinx in 2021, while federal and state elected officials across both major political parties have moved to ban the term. Arkansas’ governor banned the use of Latinx in state government documents in 2023. Meanwhile, others remain advocates for the term and other gender-neutral alternatives.

Latinx is broadly unpopular among Latino adults who have heard of it, according to the survey.75% of Latinos who have heard of the term Latinx say it should not be used to describe the Hispanic or Latino population, up from 65% saying the same in 2019.

Monday, January 29, 2024

The United States as Singular and Plural

LEE MM, ZHANG N, HERCHENRÖDER T. From Pluribus to Unum? The Civil War and Imagined Sovereignty in Nineteenth-Century America. American Political Science Review. 2024;118(1):127-143. doi:10.1017/S0003055423000096

Abstract:
Contestation over the structure and location of final sovereign authority—the right to make and enforce binding rules—occupies a central role in political development. Historically, war often settled these debates and institutionalized the victor’s vision of sovereignty. Yet sovereign authority requires more than institutions; it ultimately rests on the recognition of the governed. How does war shape imagined sovereignty? We explore the effect of warfare in the United States, where the debate over two competing visions of sovereignty erupted into the American Civil War. We exploit the grammatical shift in the “United States” from a plural to a singular noun as a measure of imagined sovereignty, drawing upon two large textual corpuses: newspapers (1800–99) and congressional speeches (1851–99). We demonstrate that war shapes imagined sovereignty, but for the North only. Our results further suggest that Northern Republicans played an important role as ideational entrepreneurs in bringing about this shift.

From the article:

Our measurement strategy leverages a grammatical change in the civic language in which the term “United States” shifted from a plural to a singular noun. Whereas at the beginning of the nineteenth-century Americans said “the United States are,” by the end of the century they were much more likely to say “the United States is.” We treat plural/singular usage as a proxy for the popular imagination of sovereignty. Specifically, we take plural usage as indicating that Americans view the United States as having multiple sovereignties embodied in the several states, and singular usage as indicating that Americans conceive of the United States as possessing a single national sovereignty.

We are not the first scholars to attribute such meaning to the usage of the plural and singular forms of the United States. For example, Civil War historian Shelby Foote linked sovereignty and speech in his observation that “Before the war, it was said ‘the United States are.’ Grammatically, it was spoken that way and thought of as a collection of independent states” (quoted in Ward1990, 273). Similarly, McPherson notes that the Civil War “marked a transition of the United States to a singular noun” and that “the ‘Union’ also became the nation” (McPherson1988, 859).


Saturday, January 20, 2024

True National

Christine Huang et al. at Pew:

Results of a Pew Research Center survey highlight language and customs as key components of national identity, while views on the importance of birthplace and religion are more divided.


Across more than 20 countries surveyed, a median of 91% say being able to speak their country’s most common language is important for being considered a true national, and 81% say sharing their country’s customs and traditions is important for true belonging. Views on the importance of birthplace and religion to national identity are mixed.

...

The United States stands out for having the lowest share who say speaking the country’s most common language is important for being a true national (78%). A relatively low share of Americans say the same about participating in the country’s traditions (71%). On the other hand, those in the U.S. place more emphasis on being a member of the country’s primary religion than people in most other high-income countries surveyed (37%). U.S. views on birthplace fall around the middle of the high-income countries (50%).

Saturday, July 1, 2023

SCOTUS Canels Loan Cancelation

 From the syllabus of Biden v. Nebraska:

The text of the HEROES Act does not authorize the Secretary’s loan forgiveness program. The Secretary’s power under the Act to “modify” does not permit “basic and fundamental changes in the scheme” designed by Congress. MCI Telecommunications Corp. v. American Telephone & Telegraph Co., 512 U. S. 218, 225. Instead, “modify” carries “a connotation of increment or limitation,” and must be read to mean “to change moderately or in minor fashion.” Ibid. That is how the word is ordinarily used and defined, and the legal definition is no different.
The authority to “modify” statutes and regulations allows the Secretary to make modest adjustments and additions to existing provisions, not transform them. Prior to the COVID–19 pandemic, “modifications” issued under the Act were minor and had limited effect. But the “modifications” challenged here create a novel and fundamentally different loan forgiveness program. While Congress specified in the Education Act a few narrowly delineated situations that could qualify a borrower for loan discharge, the Secretary has extended such discharge to nearly every borrower in the country. It is “highly unlikely that Congress” authorized such a sweeping loan cancellation program “through such a subtle device as permission to ‘modify.’” Id., at 231.
The Secretary responds that the Act authorizes him to “waive” legal provisions as well as modify them—and that this additional term “grant[s] broader authority” than would “modify” alone. But the Secretary’s invocation of the waiver power here does not remotely resemble how it has been used on prior occasions, where it was simply used to nullify particular legal requirements. The Secretary next argues that the power to “waive or modify” is greater than the sum of its parts: Because waiver allows the Secretary “to eliminate legal obligations in their entirety,” the combination of “waive or modify” must allow him “to reduce them to any extent short of waiver” (even if the power to “modify” ordinarily does not stretch that far). But the challenged loan forgiveness program goes beyond even that. In essence, the Secretary has drafted a new section of the Education Act from scratch by “waiving” provisions root and branch and then filling the empty space withradically new text.

Sunday, June 11, 2023

Terminology: "Slave" v. "Enslaved Person"

 Jay Nordlinger quotes historian Barbara Fields:

Here’s how I put it to my students. The most famous of all abolitionist speeches is probably the one that Frederick Douglass delivered in Rochester, New York, in 1852. (My grandmother told me that her teachers required pupils to memorize it.) Douglass called the speech “What to the Slave Is the Fourth of July?” He did not call it “What to the Enslaved Person Is the Fourth of July?” If it was good enough for Douglass, I tell my students, it’s good enough for me.

It is misguided to believe that “enslaved” tells more truth than “slave” because “slave” defines the victim by the perpetrator’s crime. This makes as much sense as rejecting the word “hostage” because it defines the hostage by the crime of the hostage-taker.

When I was a graduate student, it was Herbert Gutman from whom I learned an important distinction. When he spoke about slaves doing work, being punished, choosing spouses, having children, taking care of families, mourning the dead, worshiping God, and so on — in short, acting as human beings — he referred to them as “men and women.” What a powerful statement he made by that simple choice of concrete nouns. I pity the person who imagines herself achieving the same result by substituting “enslaved person” for “slave.

Monday, January 9, 2023

The Myth of Ellis Island Name Changes

Caitlin Hollander:

[We] are told by our grandparents “oh, the name was changed at Ellis Island”. And at first glance, it seems to be true- from mobsters (Meyer Lansky was born Meier Suchowlanski) to actors (Jack Benny was Benjamin Kubelsky), everyone seems to have come to America with a different name. This story is an accepted part of the early 20th century immigrant experience- that immigration officials changed the names of immigrants due to racism, misunderstandings, an attempt to “Americanize”, or simply because they did not care.

But none of it is true- simply put, it is one of the greatest urban legends ingrained in the modern American psyche. The commonly given reasons behind these supposed name changes do not hold up to the historical facts of immigration through Ellis Island.

The names recorded at Ellis Island were taken directly from the passenger manifests, which were made up at the port of departure. In addition, Ellis Island employed a number of interpreters who spoke the immigrants’ native languages. In 1911, Commissioner William Williams wrote to Washington, providing both the number of interpreters for each language and asking for funding to hire more.
...
But a more practical barrier existed to a permanent name change being made at Ellis Island in the early 20th century, and one that we do not think of in the age of digitization. Once you left Ellis Island, there was nothing indicated what name you had entered under, at least nothing that would matter in your day to day life. Depending on the era in which they had come to America, the immigrant might never see what name they had entered under. Alien Registration Forms were only created in 1940. Even when applying for citizenship, you provided first, the name you went by and second, the name under which you entered the US (as seen in the petition for naturalization above). The assumption was that the former was now your legal name. After 1906, when nationwide standardization of the process was instituted, you had to simply provide affidavits from witnesses that had known you in the US for 5 years- later on, proofs of arrival were included in petitions for naturalization, but this part of the process was only slowly adapted. And no ID existed at the time for a job, school, or housing to require. 

Monday, December 19, 2022

Language Use in the US

 Sandy Dietrich and Erik Hernandez at the US Census Bureau:

The number of people in the United States who spoke a language other than English at home nearly tripled from 23.1 million (about 1 in 10) in 1980 to 67.8 million (almost 1 in 5) in 2019, according to a recent U.S. Census Bureau report.

At the same time, the number of people who spoke only English also increased, growing by approximately one-fourth from 187.2 million in 1980 to 241 million in 2019 (Figure 1).

The report, Language Use in the United States: 2019, uses American Community Survey (ACS) data to highlight trends and characteristics of the different languages spoken in the United States over the past four decades.

The Hispanic population is the largest minority group in the United States. So it is not surprising Spanish was the most common non-English language spoken in U.S. homes (62%) in 2019 – 12 times greater than the next four most common languages.
Table 1. Five Most Frequently Spoken Languages Other Than English (LOTE) in U.S. Homes: 2019

Wednesday, June 2, 2021

Application Essays and College Inequality

Many posts have discussed iinequality and higher education.

 Scott Jaschik at Inside Higher Ed:

New research from Stanford University is among the latest to note this relationship between wealth and doing well on the SAT. But the research goes further: it says there is something that correlates more strongly with family income than the SAT. And that is the application essay.

The news is only surprising to some observers. After all, in recent years, many wealthy applicants have been paying thousands of dollars for help on their essays (in addition to the money they spend on other parts of admissions). They pay for help brainstorming about the ideas, for critiques of drafts and for help polishing up the final version.

The new study -- published as a working paper by the Stanford Center for Education Policy Analysis -- is based on 60,000 applications submitted to campuses of the University of California in November 2016. Each student wrote four short essays to apply. The applicants were limited to 350 words per essay. Students submitted an average of 1,395 words across the four essays.

The researchers then linked the subjects to SAT scores and family income. For example, "essays with more content on 'human nature' and 'seeking answers' tended to be written by applicants with higher SAT scores; in contrast, essays with more content about 'time management' and family relationships tended to be written by students with lower SAT scores."

Then, using software, the researchers analyzed "simple word and punctuation counts, grammatical categories such as pronouns and verbs, sentiment analysis, specific vocabularies such as family or health words, and stylistic measures such as narrative writing." And further, they analyzed the words and style used. "For example, sentences using more personal pronouns like I, you and she score lower in the analytic category than sentences using more articles like a, an and the." (That is their conclusion based on experience with actual essays being judged.)

They find that wealthier students write essays with the "better" qualities. "Given longstanding concern about the strength of the relationship between SAT scores and socioeconomic background, it is noteworthy to find a similar pattern across essay topics and dictionary features," the paper says.

Wednesday, August 12, 2020

"Latinx"

From Pew:
Pan-ethnic labels describing the U.S. population of people tracing their roots to Latin America and Spain have been introduced over the decades, rising and falling in popularity. Today, the two dominant labels in use are Hispanic and Latino, with origins in the 1970s and 1990s respectively.
More recently, a new, gender-neutral, pan-ethnic label, Latinx, has emerged as an alternative that is used by some news and entertainment outlets, corporationslocal governments and universities to describe the nation’s Hispanic population.
However, for the population it is meant to describe, only 23% of U.S. adults who self-identify as Hispanic or Latino have heard of the term Latinx, and just 3% say they use it to describe themselves, according to a nationally representative, bilingual survey of U.S. Hispanic adults conducted in December 2019 by Pew Research Center.

Thursday, August 9, 2018

Foreign Language Study

Overall, a median of 92% of European students are learning a language in school. Most primary and secondary school students across Europe study at least one foreign language as part of their education, according to Eurostat, the statistics arm of the European Commission. Of the 29 European nations for which data are available, 24 have a foreign language learning rate of at least 80%, with 15 of those reaching 90% or more of students enrolled in language courses. In three of the four countries with the smallest student populations – Luxembourg, Malta and Liechtenstein – 100% of students are reported to be learning a foreign language.
...
Meanwhile, far fewer K-12 students in the U.S. participate in foreign language education. Throughout all 50 states and the District of Columbia, 20% of K-12 students are enrolled in foreign language classes, according to a 2017 report from the nonprofit American Councils for International Education. New Jersey (51%) has the most students studying a language, followed by the District of Columbia (47%) and Wisconsin (36%). However, the vast majority of states have less than 25% participation, with only 9% of students studying a foreign language in New Mexico, Arizona and Arkansas. Spanish is overwhelmingly the most popular language studied, though the report also examined languages ranging from Chinese to Latin to American Sign Language.

Europe drastically outpaces U.S. in foreign language learning

Thursday, December 21, 2017

The Best Words

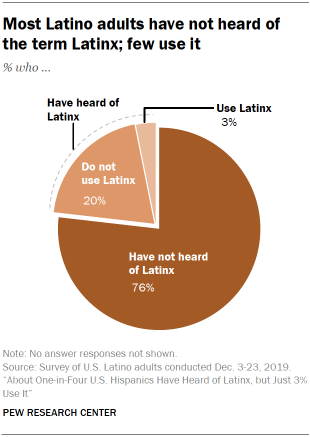
The Trump administration is waging a linguistic battle across official Washington, seeking to shift public perception of key policies by changing the way the federal government talks about climate change, scientific evidence and disadvantaged communities.

The push drew fresh attention after employees at the Department of Health and Human Services were told to avoid certain words — including “vulnerable” “entitlement” and “diversity” — when preparing requests for next year’s budget. But the effort to disappear certain language and replace it with other terms is much broader, sparking resistance from career officials in multiple federal agencies, outside experts and congressional Democrats.

Climate change, for example, has for months presented a linguistic minefield; multiple references to it have been purged repeatedly at the Environmental Protection Agency and the Interior Department. In late summer, the Office of Juvenile Justice and Delinquency Prevention issued a document to employees and contractors bearing a column of words and phrases to be avoided, alongside a column of acceptable alternatives.

  As you know, one of the key points in the GOPAC tapes is that "language matters." In the video "We are a Majority," Language is listed as a key mechanism of control used by a majority party, along with Agenda, Rules, Attitude and Learning. As the tapes have been used in training sessions across the country and mailed to candidates we have heard a plaintive plea: "I wish I could speak like Newt."

   That takes years of practice. But, we believe that you could have a significant impact on your campaign and the way you communicate if we help a little. That is why we have created this list of words and phrases.

   This list is prepared so that you might have a directory of words to use in writing literature and mail, in preparing speeches, and in producing electronic media. The words and phrases are powerful. Read them. Memorize as many as possible. And remember that like any tool, these words will not help if they are not used.

   While the list could be the size of the latest "College Edition" dictionary, we have attempted to keep it small enough to be readily useful yet large enough to be broadly functional. The list is divided into two sections: Optimistic Positive Governing words and phrases to help describe your vision for the future of your community (your message) and Contrasting words to help you clearly define the policies and record of your opponent and the Democratic party.

   Please let us know if you have any other suggestions or additions. We would also like to know how you use the list. Call us at GOPAC or write with your suggestions and comments. We may include them in the next tape mailing so that others can benefit from your knowledge and experience.

Optimistic Positive Governing Words
   Use the list below to help define your campaign and your vision of public service. These words can help give extra power to your message. In addition, these words help develop the positive side of the contrast you should create with your opponent, giving your community something to vote for!
  • active(ly)
  • activist
  • building
  • candid(ly)
  • care(ing)
  • challenge
  • change
  • children
  • choice/choose
  • citizen
  • commitment
  • common sense
  • compete
  • confident
  • conflict
  • control
  • courage
  • crusade
  • debate
  • dream
  • duty
  • eliminate good-time in prison
  • empower(ment)
  • fair
  • family
  • freedom
  • hard work
  • help
  • humane
  • incentive
  • initiative
  • lead
  • learn
  • legacy
  • liberty
  • light
  • listen
  • mobilize
  • moral
  • movement
  • opportunity
  • passionate
  • peace
  • pioneer
  • precious
  • premise
  • preserve
  • principle(d)
  • pristine
  • pro- (issue): flag, children, environment, reform
  • prosperity
  • protect
  • proud/pride
  • provide
  • reform
  • rights
  • share
  • strength
  • success
  • tough
  • truth
  • unique
  • vision
  • we/us/our
Contrasting Words
   Often we search hard for words to define our opponents. Sometimes we are hesitant to use contrast. Remember that creating a difference helps you. These are powerful words that can create a clear and easily understood contrast. Apply these to the opponent, their record, proposals and their party.
  • abuse of power
  • anti- (issue): flag, family, child, jobs
  • betray
  • bizarre
  • bosses
  • bureaucracy
  • cheat
  • coercion
  • "compassion" is not enough
  • collapse(ing)
  • consequences
  • corrupt
  • corruption
  • criminal rights
  • crisis
  • cynicism
  • decay
  • deeper
  • destroy
  • destructive
  • devour
  • disgrace
  • endanger
  • excuses
  • failure (fail)
  • greed
  • hypocrisy
  • ideological
  • impose
  • incompetent
  • insecure
  • insensitive
  • intolerant
  • liberal
  • lie
  • limit(s)
  • machine
  • mandate(s)
  • obsolete
  • pathetic
  • patronage
  • permissive attitude
  • pessimistic
  • punish (poor ...)
  • radical
  • red tape
  • self-serving
  • selfish
  • sensationalists
  • shallow
  • shame
  • sick
  • spend(ing)
  • stagnation
  • status quo
  • steal
  • taxes
  • they/them
  • threaten
  • traitors
  • unionized
  • urgent (cy)
  • waste
  • welfare

Tuesday, September 19, 2017

Hispanic Population: Graphs

Pew offers interactive charts on Hispanic population trends:

Wednesday, August 9, 2017

Yet Another Spelling Error

The Trump staff makes many stupid mistakes.

Tuesday, February 28, 2017

Language Study

A release from the American Academy of Arts and Sciences:
The American Academy of Arts and Sciences today released the final report and recommendations of the Commission on Language Learning, a national effort established to examine the current state of U.S. language education, to project what the nation’s education needs will be in the future, and to offer recommendations for ways to meet those needs.
...
While more than 65 million U.S. residents speak a language other than English at home, that number represents only 20.7 percent of the total population, and only a fraction of this cohort is considered proficient in reading, writing, and speaking a second language.

The vast majority of American citizens remain monolingual.

....

The Commission’s five recommendations are:
  • Increase the number of language teachers at all levels of education so that every child in every state has the opportunity to learn a language in addition to English.
    • Encourage the coordination of state credentialing systems so that qualified teachers can find work in regions where there are significant shortages.
    • Attract talented and enthusiastic language teachers through federal loan forgiveness programs.
    • Develop and distribute online and digital technologies, as well as blended learning models, particularly in communities with a short supply of language teachers.
    • Provide new opportunities for advanced study in languages in higher education—for future language teachers as well scholars in other fields—through a recommitment to language instruction, blended learning programs, and the development of new regional consortia allowing colleges and universities to pool learning resources.
  • Supplement language instruction across the education system through public-private partnerships among schools, government, philanthropies, businesses, and local community members.
    • Draw on local and regional resources by working with heritage language communities and other local experts to create in-school and after-school instructional programs.
    • Maintain support for state humanities councils and other organizations that create vital language and cultural resources for local communities.
  • Support heritage languages already spoken in the United States, and help these languages persist from one generation to the next.
    • Encourage heritage language speakers to pursue further instruction in their heritage languages.
    • Provide more language learning opportunities for heritage speakers in classroom or school settings.
    • Expand efforts to create college and university curricula designed specifically for heritage speakers and to offer course credit for proficiency in heritage language.
  • Provide targeted attention to Native American languages as defined in NALA.
    • Increase support for the use of Native American languages as the primary languages of education, and for the development of curricula and education materials for such programs.
    • Provide opportunities for Native Americans and others to study Native American languages in English-based schools with appropriate curricula and materials.
  • Promote opportunities for students to learn languages in other countries, by experiencing other cultures and immersing themselves in multilingual environments.
    • Encourage high schools and universities to facilitate learning abroad opportunities for students.
    • Increase the number of international internships sponsored by businesses and NGOs.
    • Restructure federal financial aid to help low-income undergraduates experience study abroad during the summer as well as the academic year.
The full report, entitled America’s Languages: Investing in Language Education in the 21st Century, is available at http://www.amacad.org/language.
ges and international education.

Wednesday, February 8, 2017

National Identity: Birthplace, Language, Custom and Religion

Bruce Stokes writes at Pew:
Debates over what it means to be a “true” American, Australian, German or other nationality have often highlighted the importance of a person being born in a particular country. But contrary to such rhetoric, a Pew Research Center survey finds that people generally place a relatively low premium on a person’s birthplace. Only 13% of Australians, 21% of Canadians, 32% of Americans and a median of 33% of Europeans believe that it is very important for a person to be born in their country in order to be considered a true national.
There are some exceptions – Hungary (52%), Greece (50%) and Japan (50%) – where about half the public considers birthplace to be very important. But in other nations – Germany (13%), Australia (13%) and Sweden (8%) – very few people make a strong connection between the locale of one’s birth and national identity.
These are the findings from a cross-national poll by Pew Research Center, conducted in 14 countries among 14,514 respondents from April 4 to May 29, 2016.
While many in the countries surveyed are open to those born elsewhere being part of “the nation,” acceptance comes with certain requisites. Majorities in every country surveyed say it is very important to speak the dominant language to be considered truly a national of that land. This includes a median of 77% in Europe and majorities in Japan (70%), the U.S. (70%), Australia (69%) and Canada (59%).
In addition, sharing national customs and traditions is very important to many people’s sense of “who is us.” Just over half the public in Canada (54%) and roughly half the public across Australia (50%) and Europe (a median of 48%) links adoption of local culture to national identity. Somewhat fewer than half of Americans (45%) and Japanese (43%) make that connection.

The survey also asked about the link between religious affiliation and national identity. About a third (32%) of people in the U.S. believe it is very important to be Christian to be considered truly American. This contrasts with 54% of Greeks who say this, but only 7% of Swedes.

Wednesday, September 2, 2015

Back to School

From the Census:

Monday, July 13, 2015

Learning Languages: US and Europe

Pew reports:
A popular stereotype of Americans traveling abroad is the tourist who is at a loss when it comes to coping with any language other than English. Fair or not, the fact is that while the U.S. does not have a national requirement for students to learn a foreign language in school, the typical European pupil must study multiple languages in the classroom before becoming a teen.
Studying a second foreign language for at least one year is compulsory in more than 20 European countries. In most European countries, students begin studying their first foreign language as a compulsory school subject between the ages of 6 and 9, according to a 2012 report from Eurostat, the statistics arm of the European Commission. This varies by country and sometimes within a country, with the German-speaking Community of Belgium – one of the three federal communities of Belgium– starting its 3-year-olds on a foreign language, but parts of the United Kingdom (excluding Scotland) waiting until age 11.

Tuesday, June 10, 2014

Foreign-Born Population and English Speaking Ability

The Census reports:
In 2012, 44 percent of the foreign-born population age 5 and older who arrived in the United States in 2000 or later reported high English-language speaking ability, according to a U.S. Census Bureau report released today. This means they either reported speaking only English at home or reported speaking it "very well" whether or not they did so at home.
About 13 percent did not speak English at all. By comparison, 63 percent of immigrants who arrived prior to 1980 had high English-speaking ability in 2012, while only 6 percent did not speak English at all.
A new report, English-Speaking Ability of the Foreign-Born Population in the United States: 2012, uses statistics from the Census Bureau's American Community Survey to focus on the relationships between English-speaking ability and place of birth, level of education and years spent living in the United States.
"In general, people who migrated to the United States a long time ago speak English better today than those who migrated recently, and those with more education have higher English-speaking ability than those with less education," said demographer Christine Gambino of the Census Bureau's Foreign-Born Population Branch, one of the report's authors. "This association between time in the United States and educational attainment is seen whether immigrants are from Africa, Asia, Europe and Latin America or the Caribbean."
Almost three-fourths (73 percent) of the foreign-born age 25 and over with a bachelor's degree or higher had high English-speaking ability, speaking only English at home or speaking another language at home and speaking English "very well." The same was true for only 19 percent who had less than a high school education.
The English-speaking ability of the foreign-born does vary geographically. The proportion of foreign-born age 5 and older speaking a language other than English at home was higher in California, Illinois, Nebraska, Nevada, New Mexico, and Texas, at about nine in 10, compared with 85 percent nationally. Furthermore, in all of these states except Nevada, a majority of the foreign-born spoke English less than "very well" (that is, "well," "not well," or "not at all"). For example, 59 percent of the foreign-born in Texas and 57 percent in California spoke English less than "very well," compared with 50 percent nationwide.
Other highlights:

  • Among the nearly 41 million foreign-born 5 and older residing in the United States, 15 percent spoke only English at home. More than one-third (35 percent) spoke a non-English language at home and also spoke English "very well," resulting in about half of the foreign-born having high English-speaking ability.
  • Over time, the foreign-born have become more likely to speak a language other than English at home, with this percentage rising from 70 percent in 1980 (among those 5 and older) to 79 percent in 1990, 83 percent in 2000 and 85 percent in 2012.
  • New Hampshire and the District of Columbia had among the lowest proportions who spoke English less than "very well" (both about 30 percent) among states or equivalents with a foreign-born population age 5 and older of 50,000 or more.
  • The foreign-born age 5 and over from Canada, Germany, Jamaica and the United Kingdom were comprised almost entirely of those with high English-speaking ability. Furthermore, the majority of those from India and the Philippines, where English is widely used as an official language, had high English-speaking ability (74 percent and 70 percent, respectively).
  • More than half of the foreign-born age 5 and over from Mexico, China, El Salvador, Vietnam, Cuba and Korea spoke English less than "very well." Each of these countries contributed at least 1 million foreign-born residents.

Monday, August 12, 2013

Languages in the United States

An earlier post discussed Americans' knowledge of languages other than English.  The Census Bureau reports:
The 2011 Language Mapper shows where people speaking specific languages other than English live, with dots representing how many people speak each of 15 different languages. For each language, the mapper shows the concentration of those who report that they speak English less than "very well," a measure of English proficiency. The tool uses data collected through the American Community Survey from 2007 to 2011.
"This map makes it easy for anyone to plan language services in their community," said Nancy Potok, the Census Bureau's acting director. "Businesses can tailor communications to meet their customers' needs. Emergency responders can use it to be sure they communicate with people who need help. Schools and libraries can offer courses to improve English proficiency and offer materials written in other languages."
The languages available in the interactive map include Spanish, French, French Creole, Italian, Portuguese, German, Russian, Polish, Persian, Chinese, Japanese, Korean, Vietnamese, Tagalog and Arabic. After selecting one of these languages from the menu, users will see a national population density map, with each dot representing about 100 people who speak the language at home placed where these speakers are concentrated. The map also allows users to zoom in to a smaller geographic area, where each dot represents 10 people. The dots were placed in a random location within census tracts to protect the confidentiality of speakers.
Also released today, the report, Language Use in the United States: 2011, [PDF] details the number of people speaking languages other than English at home and their ability to speak English, by selected social and demographic characteristics. It shows that more than half (58 percent) of U.S. residents 5 and older who speak a language other than English at home also speak English "very well." The data, taken from the American Community Survey, are provided for the nation, states and metropolitan and micropolitan areas.r the nation, states and metropolitan and micropolitan areas.